- Published on
Houston has topography: Looking at why Buffalo Bayou does not drain to the sea, directly
Introduction
First, the title is a bit of misnomer to make it sound more interesting. Buffalo Bayou does, in fact, drain to the sea, but it does so by ignoring the Gulf of Mexico to its south, flowing east to the Galveston Bay, and then from there into the Gulf of Mexico. This is different from many of the other rivers in the area, which tend to flow south south east on a more purposeful looking path to the sea. This blog post uses a DEM (Digital Elevation Map) and relative elevation map (REM) to take a look at the topography of the greater Houston area and see what it can tell us about why Buffalo bayou takes that particular path.
The REM was created as part of looking at data for a Houston Geologic Society working group looking at better understanding the geology of the Buffalo Bayou. This post is not about that larger and more detailed geological story but simply what you can see in the REM and elevation profiles. You can find that more scientific piece in the June 2025 issue of the HGS Bulletin. This blog post is mostly just to post some pretty pictures strung together with a bit of context focused on the present date elevation aspects. You can find the data processing details and how to replicate in the GitHub repository: JustinGosses/buffalo_bayou_geology_REM
Houston generally feels like a very flat place living in it, so it is refreshing to see all the topographical detail that can be made visible with a relative elevation map.
What is a Digital Elevation Map (DEM) and Relative Elevation Map (REM)
Digital Elevation Map (DEM)
A digital elevation map (DEM) is a 3D representation of a terrain's surface. It is a raster file that contains elevation values for specific points on the terrain. DEMs are like contoured topography maps, but they have a higher resolution and are more detailed with each pixel representing a specific elevation value.
Data for the DEM
The digital elevation model or DEM used in this repository came from Open Topography's topographic data locator and download tools.
The dataset itself is sourced from USGS (United Stats Geologic Survey), specifically the USGS 1/3 arc-second Digital Elevation Model(USGS10m).
United States Geological Survey (2021). United States Geological Survey 3D Elevation Program 1/3 arc-second Digital Elevation Model. Distributed by OpenTopography. https://doi.org/10.5069/G98K778D. Accessed: 2024-05-25
This material was based on data, processing services provided by the OpenTopography Facility with support from the National Science Foundation under NSF Award Numbers 1833703, 1833643, and 1833632.
The full metadata details of the downloaded data can be found in the metadata file at https://portal.opentopography.org/rasterOutput?jobId=rt1716147037733&metadata=1
Due to size constraints, most of the images in this blog post will be screenshots and not at full resolution.
Relative Elevation Map (REM)
DEMs are great by themselves for many applications, but there are times when fine details in topography are very hard to see in them due to the total range of elevation values captured in the map. One way to show those fine details at the expense of accurate showing the total range of elevation is a REM. In a relative elevation map, the elevation of a point is shown as the difference between the elevation of that point and some other often calculated average or nearest point. One way to think of a REM is as a map that shows the difference in elevation between two points. The second point can be the average elevation of the area with a half miles circle, or it can be the elevation of the nearest river centerline. Making REMs referenced to river center lines can be useful for understanding small variations in topography in relation to the river's path and that was used in the images in this blog post.
RiverREM
Specifically, I used the RiverREM Python package by Larrieu, K. (2022). RiverREM (Version 1.0.4) [Computer software]. https://github.com/OpenTopography/RiverREM A great description of how and why to use it can be found in an Open Topography blog post
I used the default configuration for the most part. The only change I made was to not let the program find the largest river in the area of the DEM. While the RiverREM package assumes you're looking at the floodplain for a single river, I was looking taking a regional view with many rivers in the area of interest as well as bays and coastlines. Therefore, I parsed river center lines, coastline, and lakes while ignoring smaller water bodies like marshes, ponds, and drainage ditches from a collection of shape files put out by the USGS & EPA are region 12 of the National Hydrology Dataset or NHD. The code will eventually put out on a public GitHub repository once I clean the git history of the large TIF files.
You can find more details on this process in the Jupyter Notebook I used to create a small scale REM focused on Buffalo Bayou.
Where are we
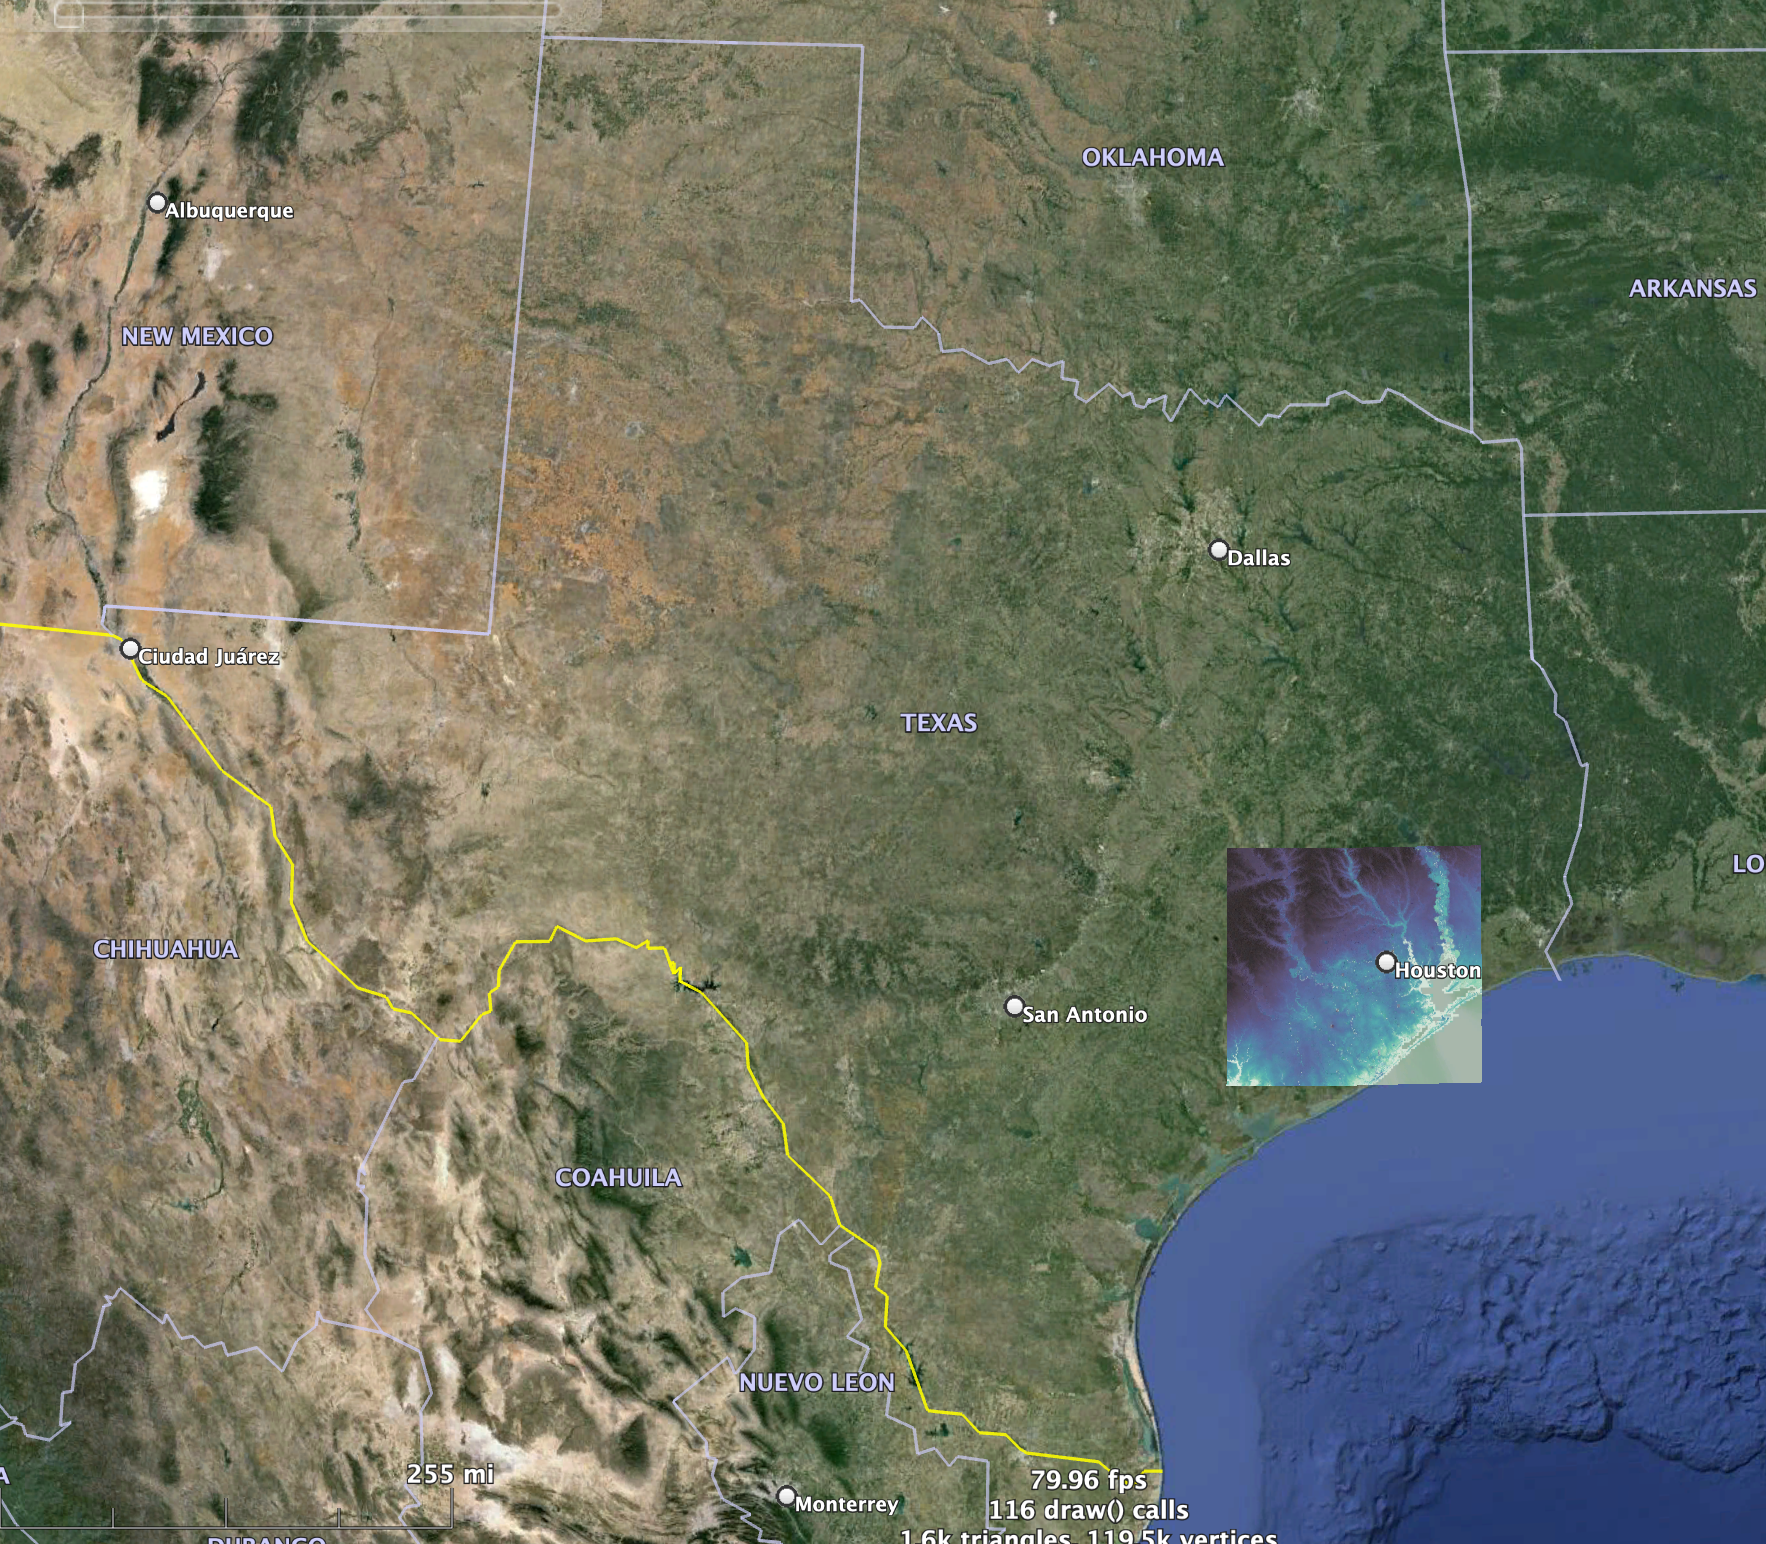
The bluish square on this map of Texas is the extent of the Houston region REM data. The hard to see scale bar in the lower left corner represents the scale of 255 miles.
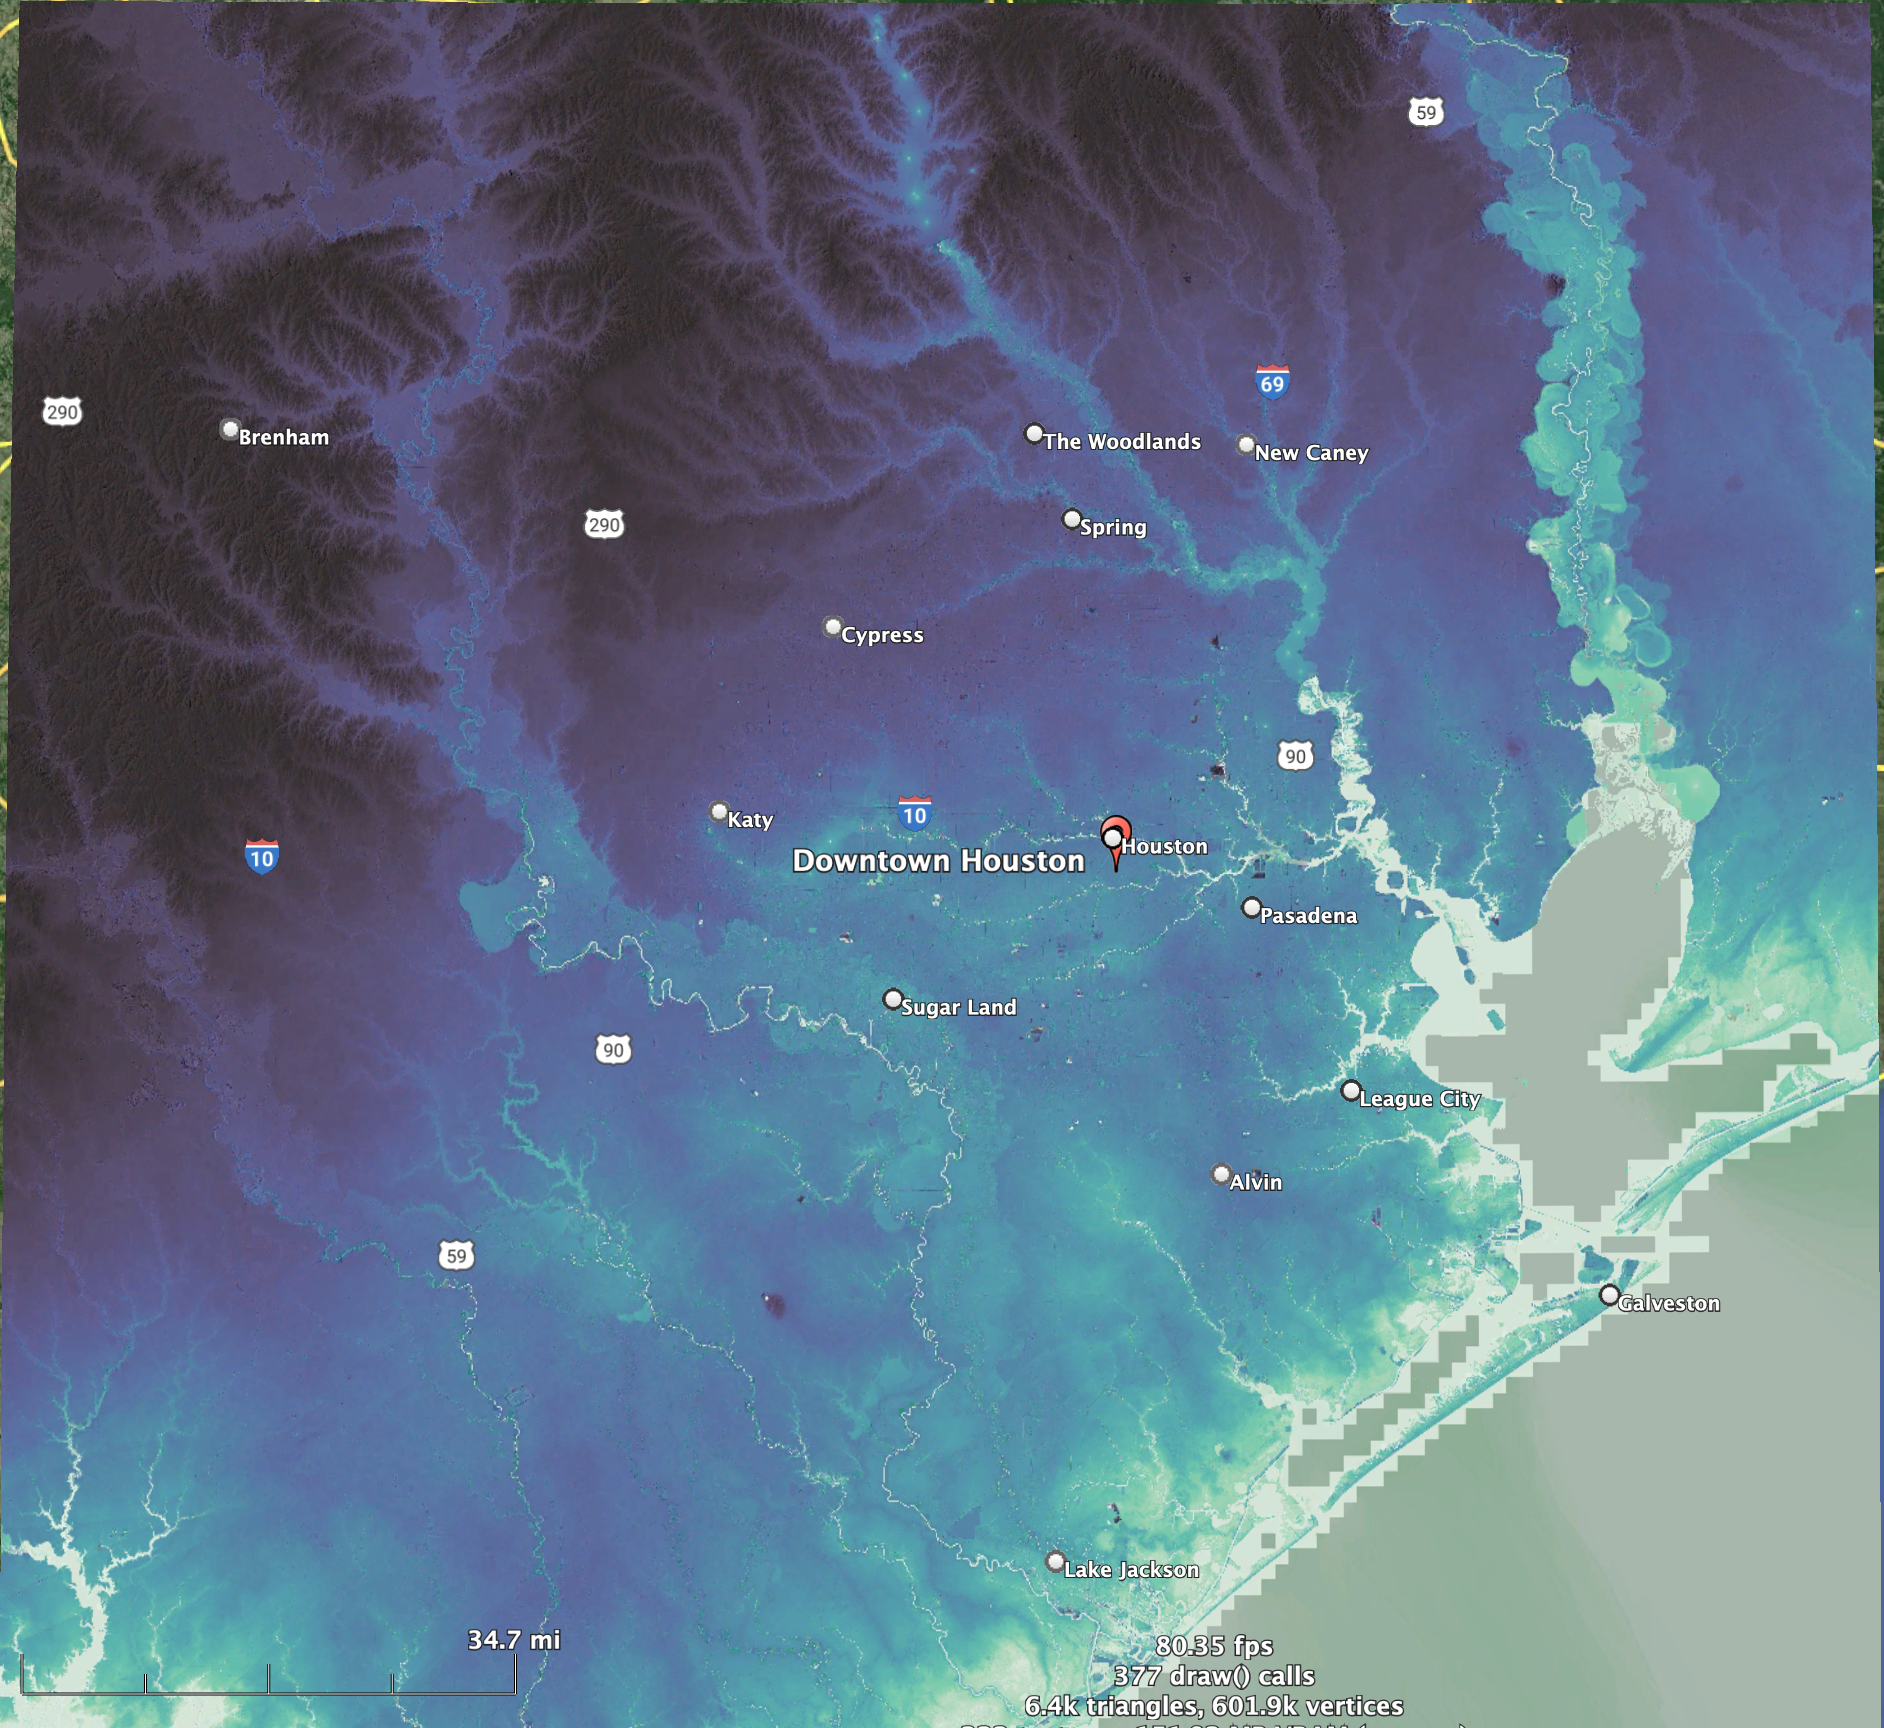 Greater Houston area relative elevation map.
The colors represent approximately the difference in elevation between the point and the nearest river centerline.
Hence, there's no point in adding a scale bar as the colors are relative not absolute.
Greater Houston area relative elevation map.
The colors represent approximately the difference in elevation between the point and the nearest river centerline.
Hence, there's no point in adding a scale bar as the colors are relative not absolute.
Coastal plain with actual topography vs. pancake coastal plain
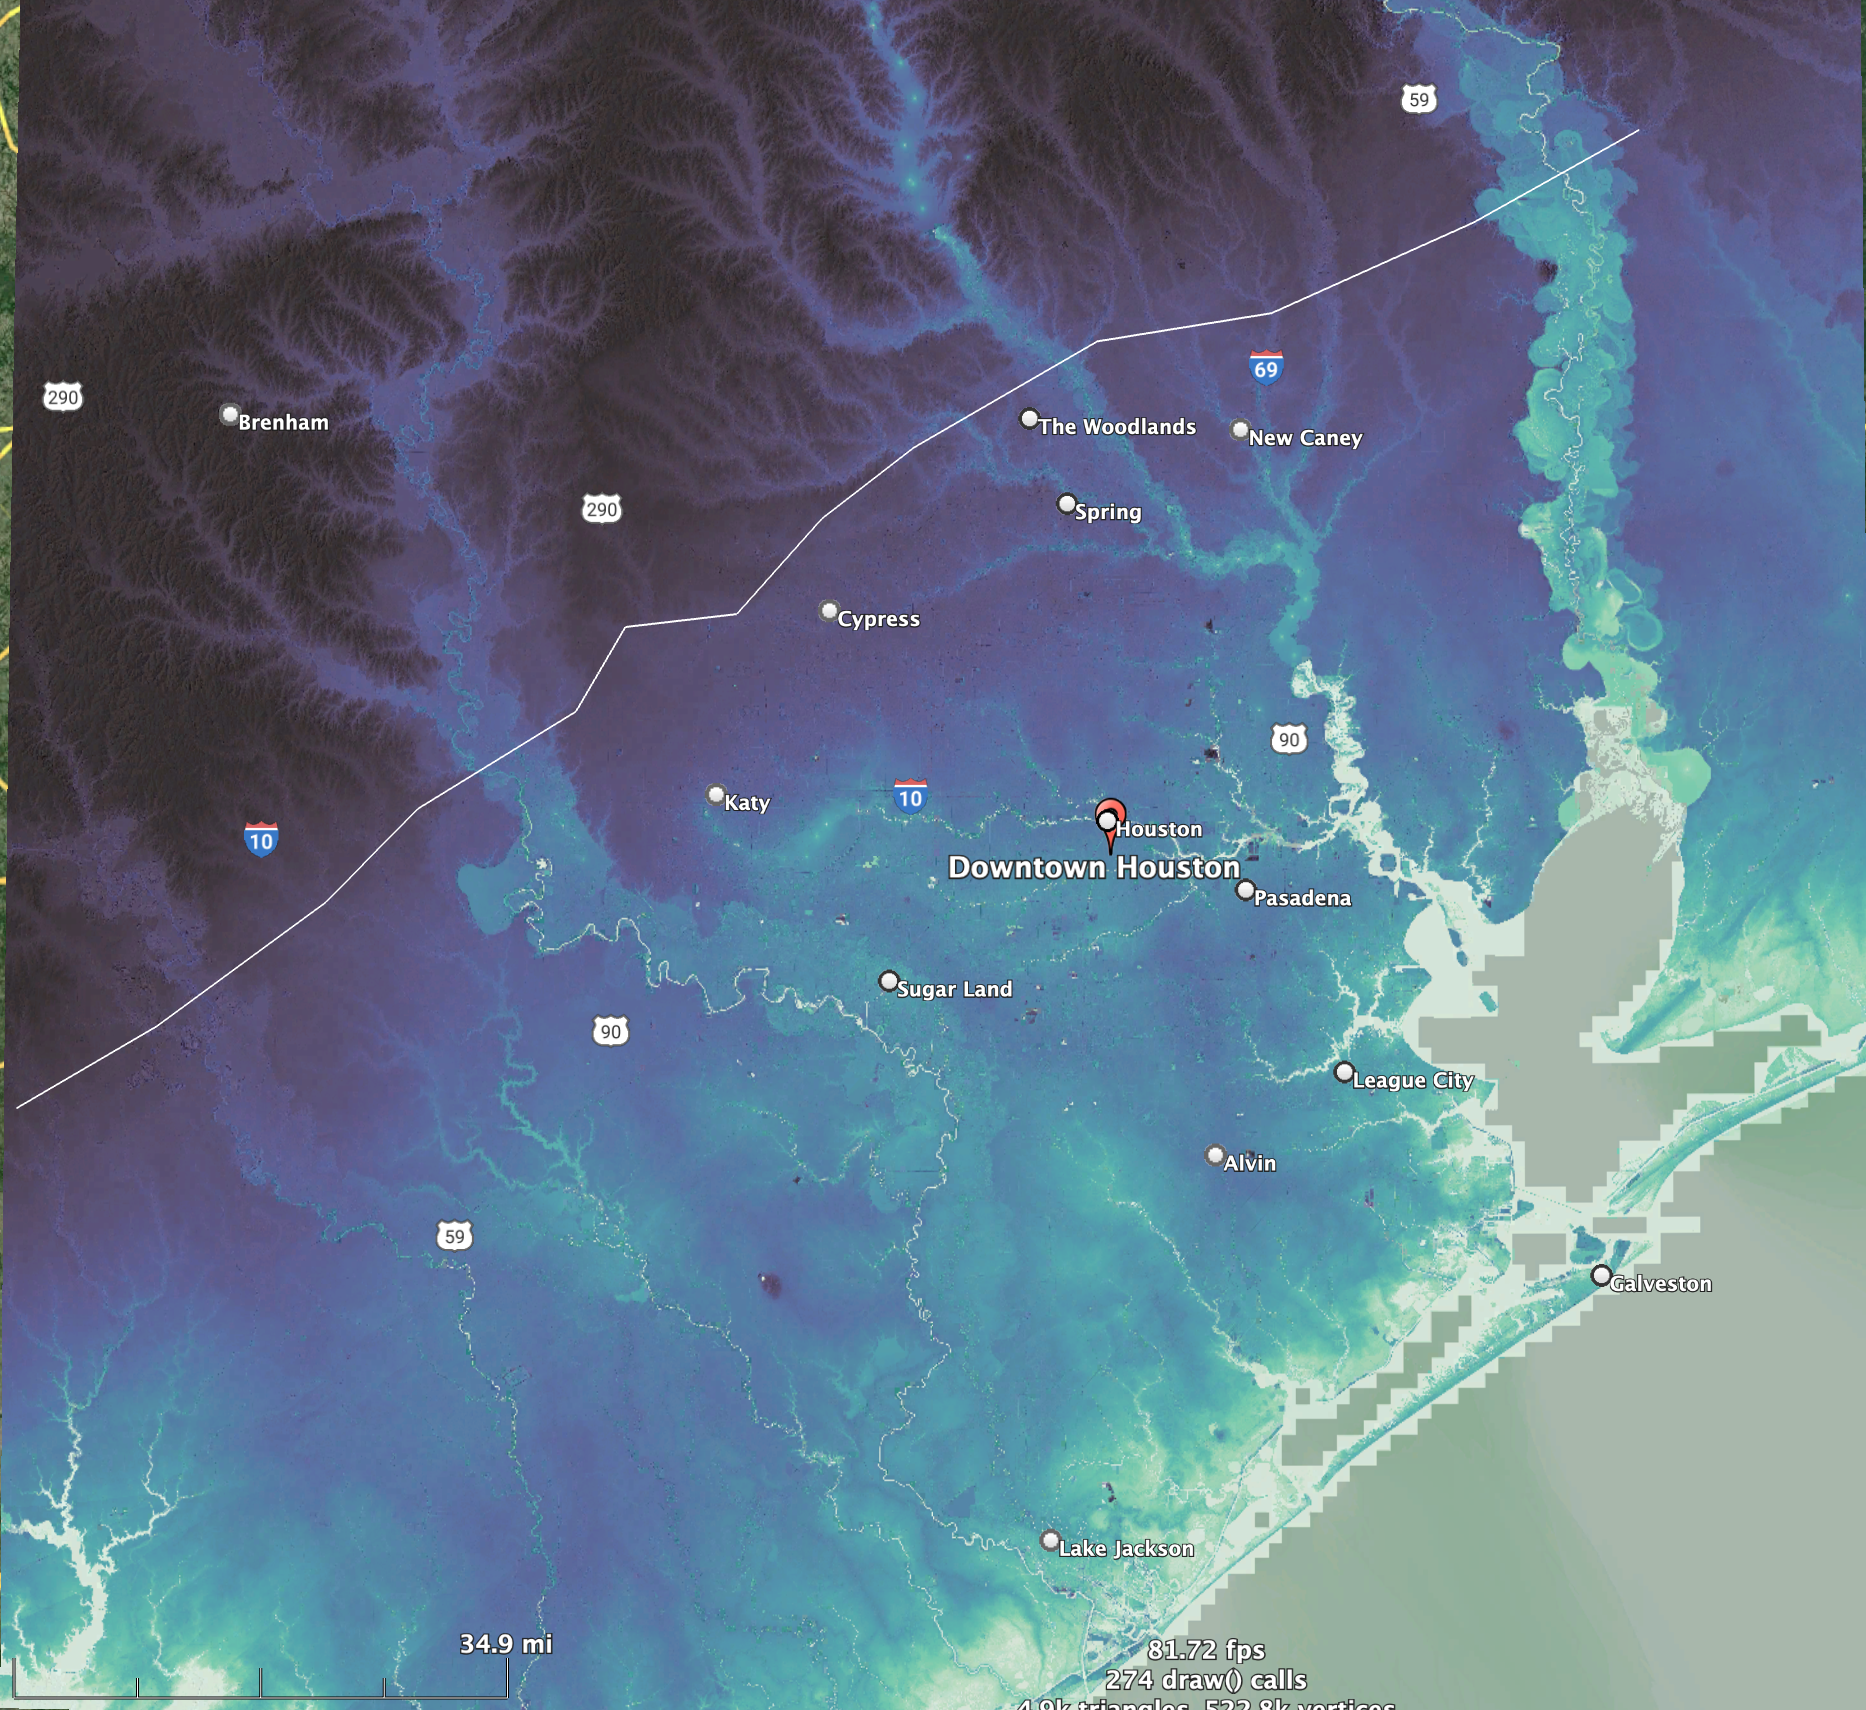 White line marks approximate edge of pancake coastal plain vs. coastal plain with slight topography.
One of the things apparent in the REM is that there is a change in topgraphic patterns that runs diagonally across the map southwest to northeast. This line is marked by the white line in the image above. Above that line you have slight rolling hills and valley formed by regular erosional dendretic river drainage. Below that line, there's more of pattern of a flag pancake with rivers either plowing a valley through it or eroding sharp channels into it as will be discussed later. Although I've drawn it as a straight line, I am not sure it is necessarily always a sharp line in reality.
I suspect that change in topography represents the max extent to which sea level's fairly direct influence on deposition and erosion patterns has reached. When rivers are close to sea level, there isn't gravitational energy to erode much of a valley or transport sediment and materials either immediately or progressively over time spread out and form a very even topography.
local erosional rivers vs. pass through rivers
Another observations that's easy to make looking at the REM is that there are two obvious classes of rivers. One is larger with active channels moving through larger valleys to either a sea or bay. These have large drainage areas out of view of the REM. Brazos River, San Jacinto, and Trinity are all examples.
The other class of rivers are smaller with morphology that seems much more erosional without as much visible evidence of storing reworked sediment in their much smaller values. They other have more branching behaviors as well. These rivers are more local to the area of the REM and have much smaller drainage areas. Buffalo Bayou, Sims Bayou, Brays Bayou, and Clear Creek are examples.
Watershed Extent: local erosional rivers vs. pass through rivers
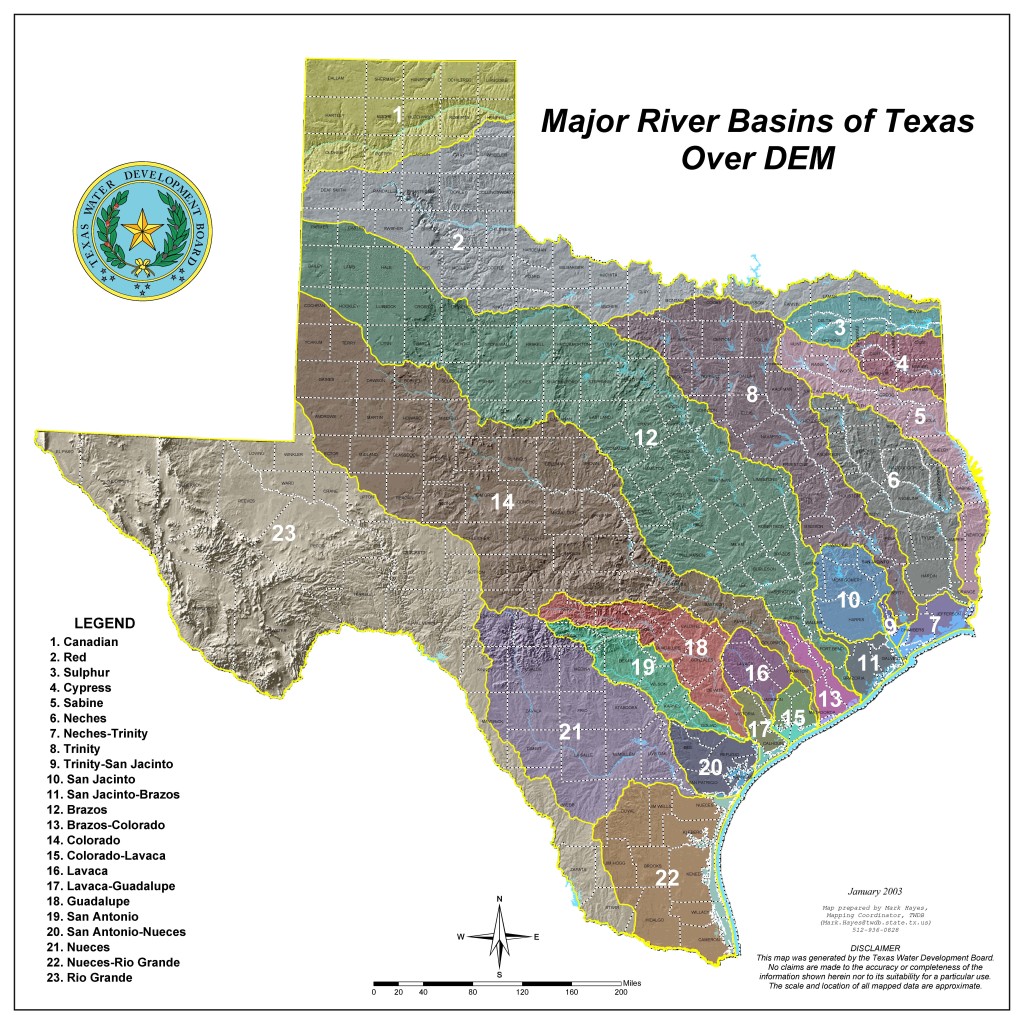 Map of river basin boundaries across the state of Texas. Brazos is area 12. Trinity is area 8.
San Jacinto is area 9. All the bayous between Brazos and the Jan Jacinto are grouped in
area 11.
Map of river basin boundaries across the state of Texas. Brazos is area 12. Trinity is area 8.
San Jacinto is area 9. All the bayous between Brazos and the Jan Jacinto are grouped in
area 11.
What is obvious from the map above is how much larger an area Brazos River drains compared to the bayous in the Houston area. The Brazos drains additional area outside of this Texas state map. This large drainage area, the elevation it drains, and type of geology is covers contribute to it carrying a large sediment load. While the San Jacinto and Trinity rivers are also rather large, they behave like many rivers of their size along the Texas coast and stop in bays. The Brazos in contrast, has enough sediment to fill in what would be a bay and instead makes a delta right into the Gulf of Mexico shoreline.
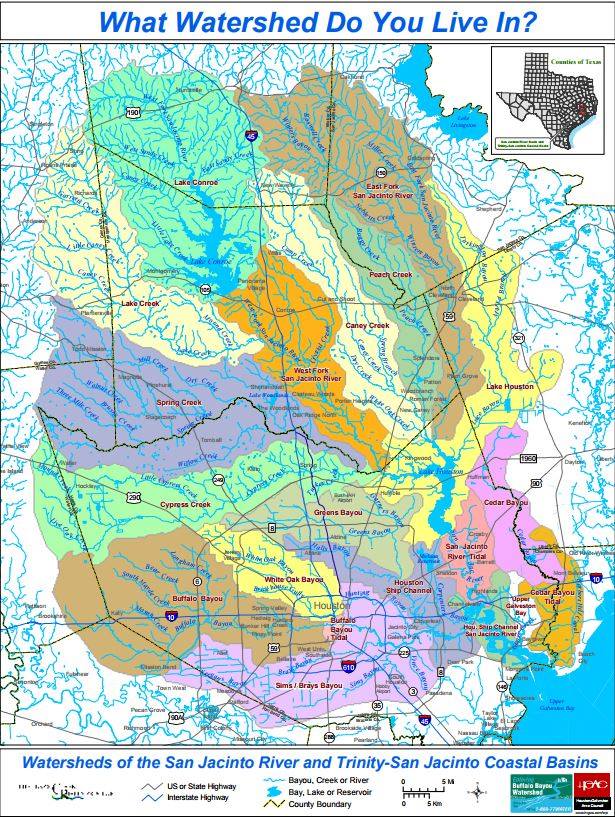 Map of the watersheds of the bayous around Houston.
Map from the Houston-Galveston Area Council, not for legal purposes.
Map of the watersheds of the bayous around Houston.
Map from the Houston-Galveston Area Council, not for legal purposes.
The map above shows the bayous around Houston. The Brazos is the large river to the west that is not colored. The Trinity is the large river to the east that is not colored. Buffalo bayou is brown. One observation that is easy to make from this particular way of representing the bayous is that many of the bayous have more branches and longer branches on their north side versus their south side suggesting an asymmetry in their individual basin shape.
Pass through rivers: Valley morphology
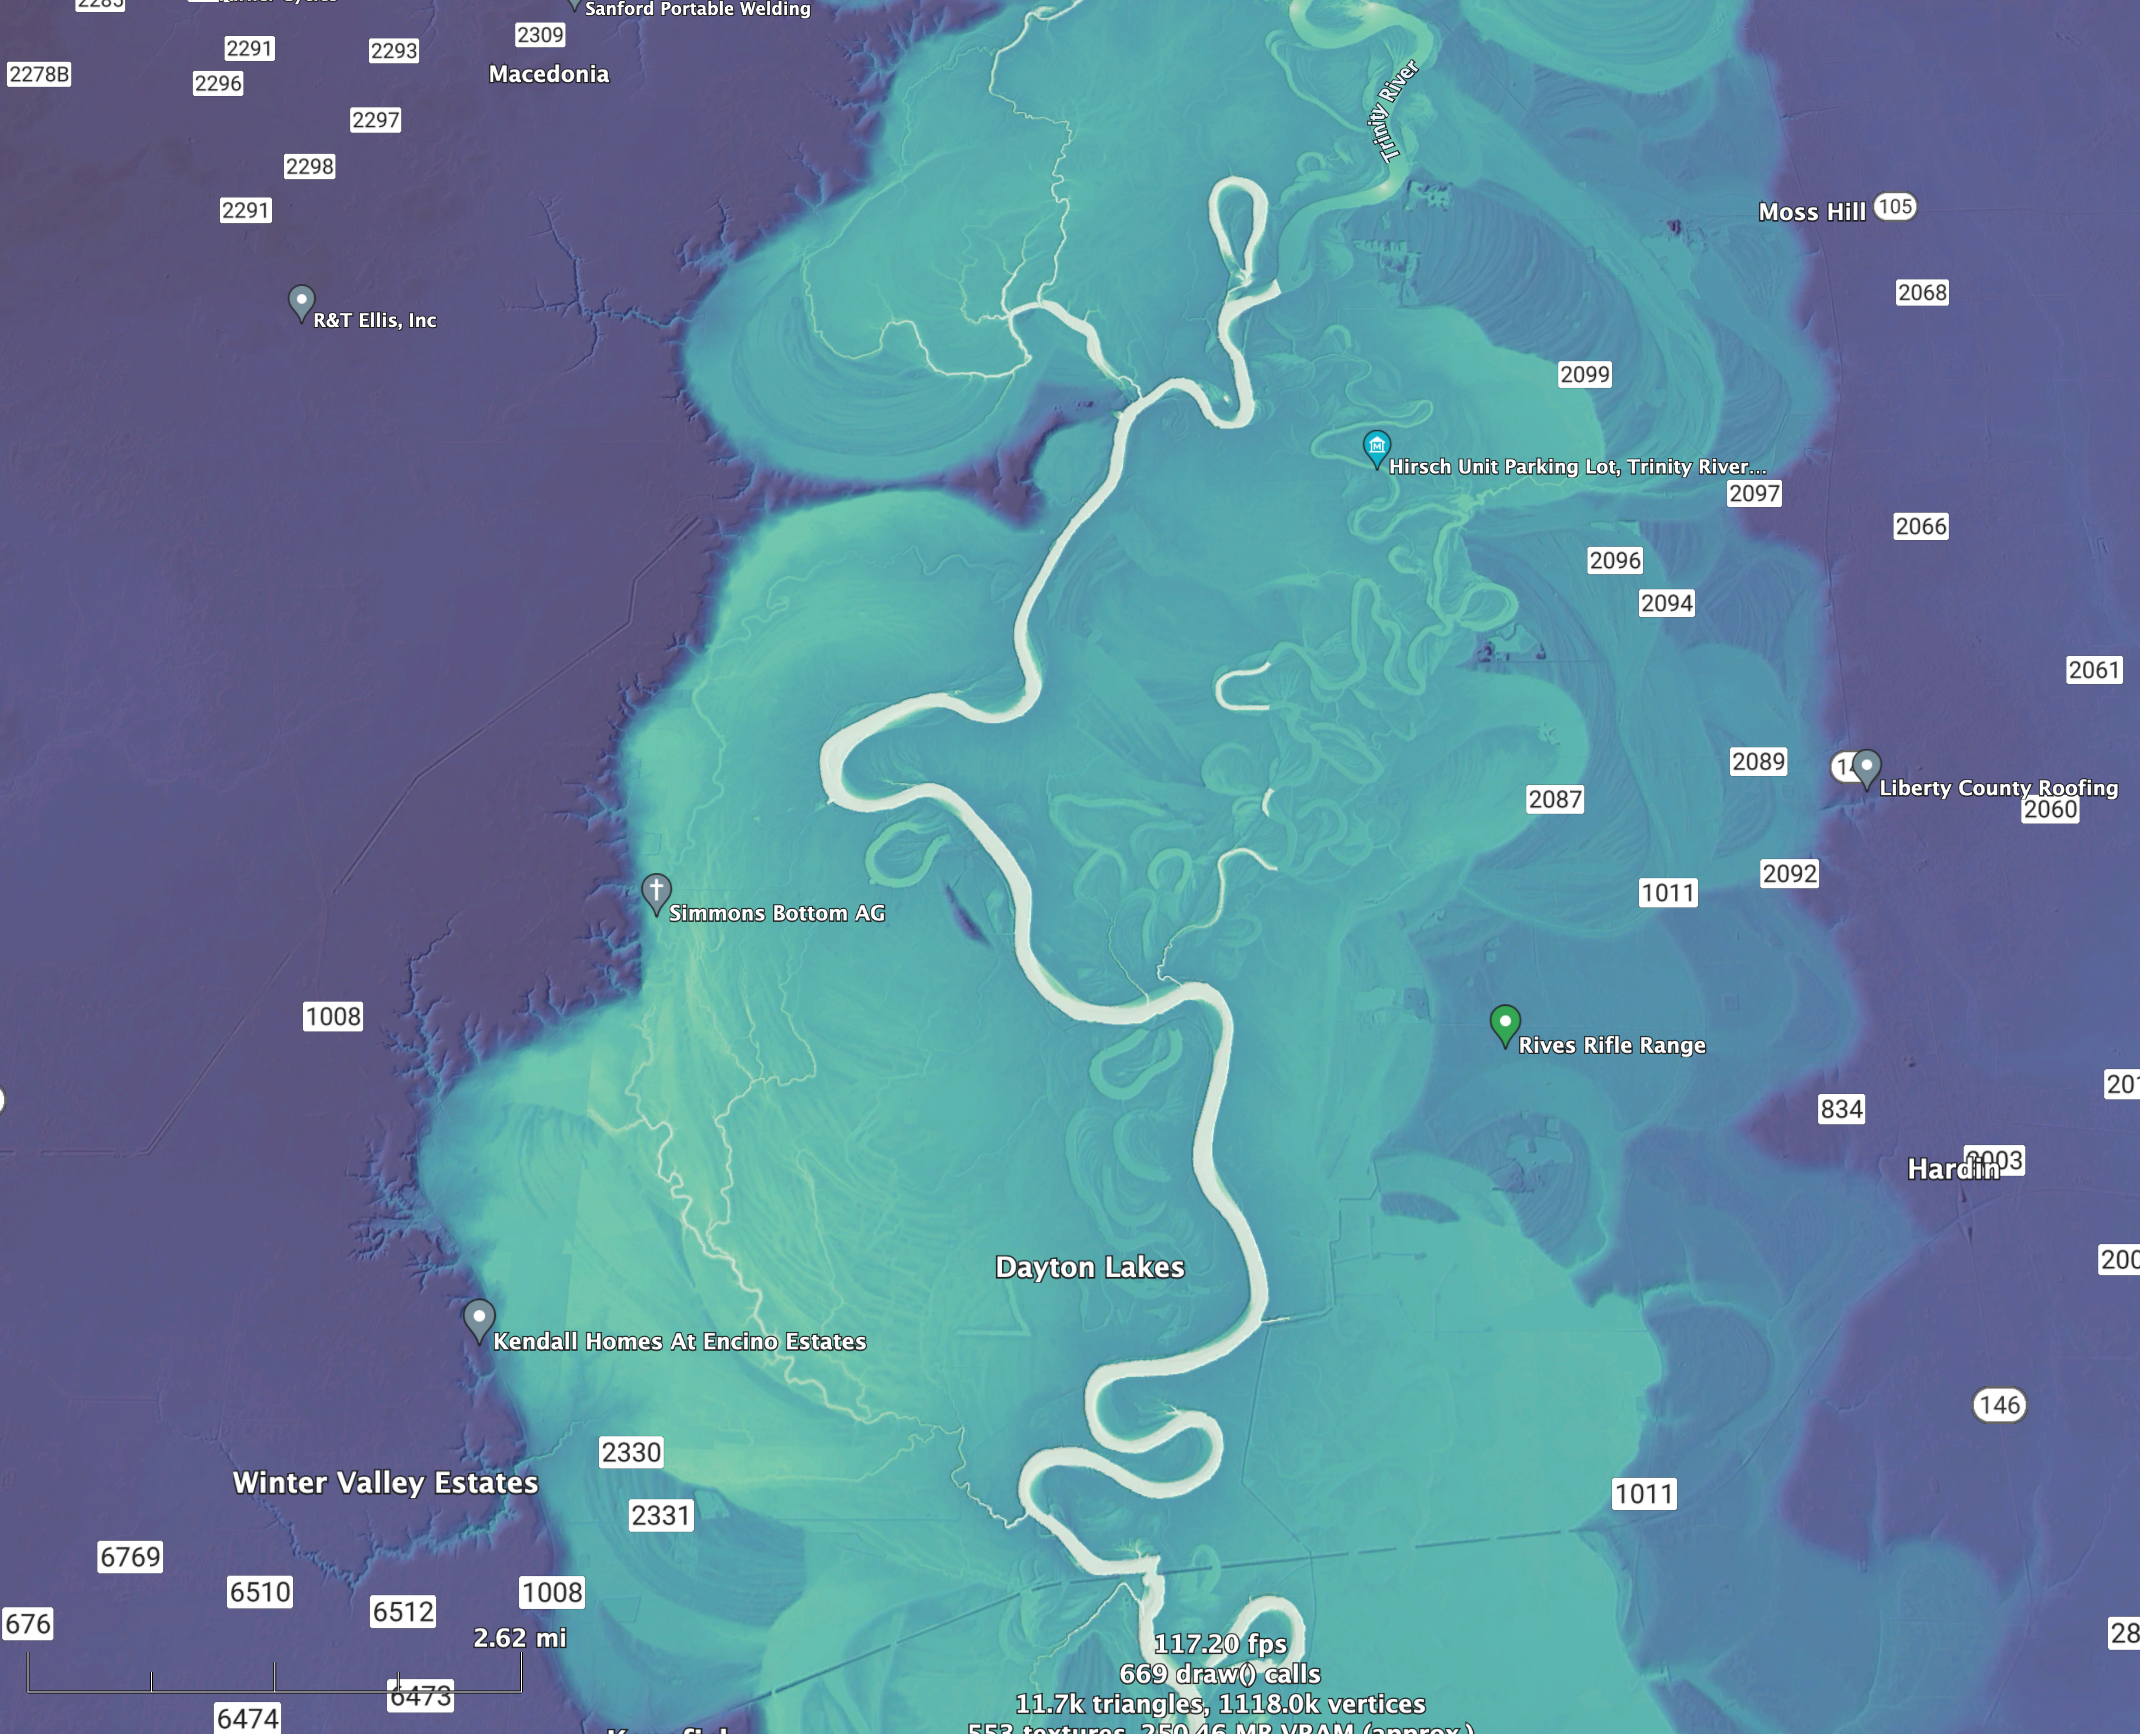 Trinity river relative elevation map north east of Houston. Shows large valley morphology
with history of meanders eroding and depositing into each other over time and small erosional
cuts draining into the valley form its side.
Trinity river relative elevation map north east of Houston. Shows large valley morphology
with history of meanders eroding and depositing into each other over time and small erosional
cuts draining into the valley form its side.
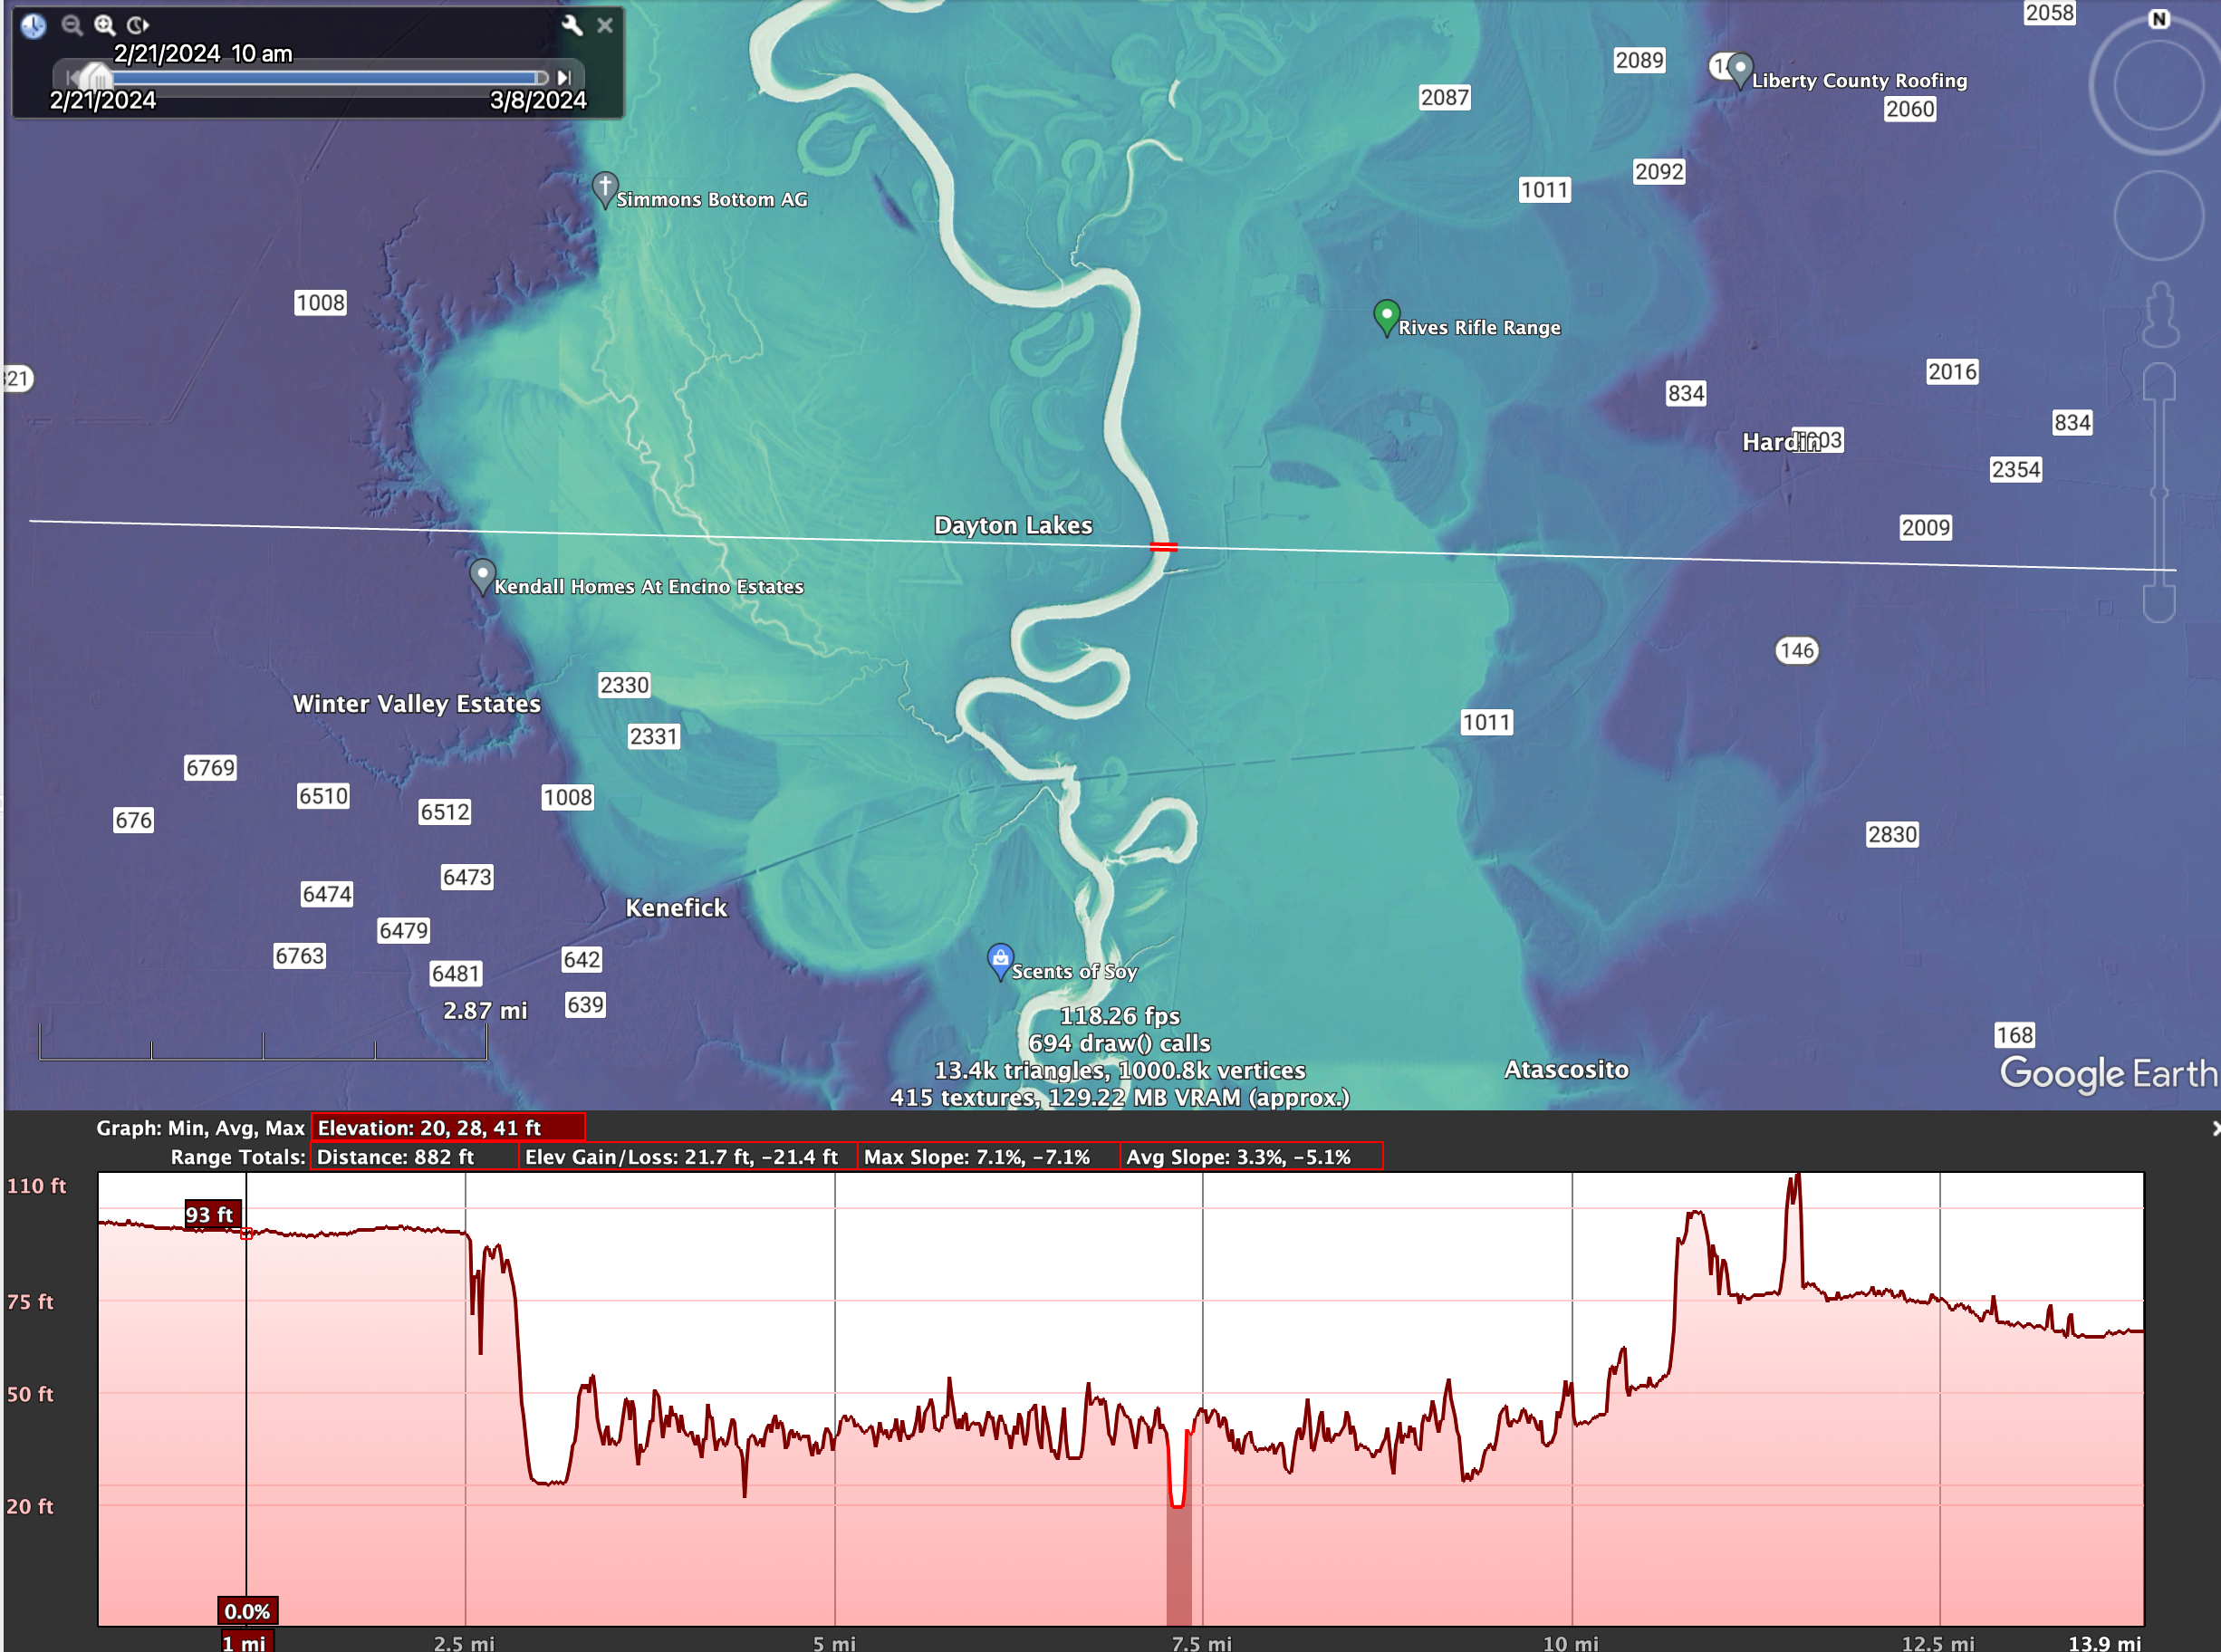 An elevation profile of the same area, shows the valley contains a large amount of abandoned channels
and bars with a smaller active channel and comparatively steep valley sides.
An elevation profile of the same area, shows the valley contains a large amount of abandoned channels
and bars with a smaller active channel and comparatively steep valley sides.
Local erosional rivers: Valley morphology
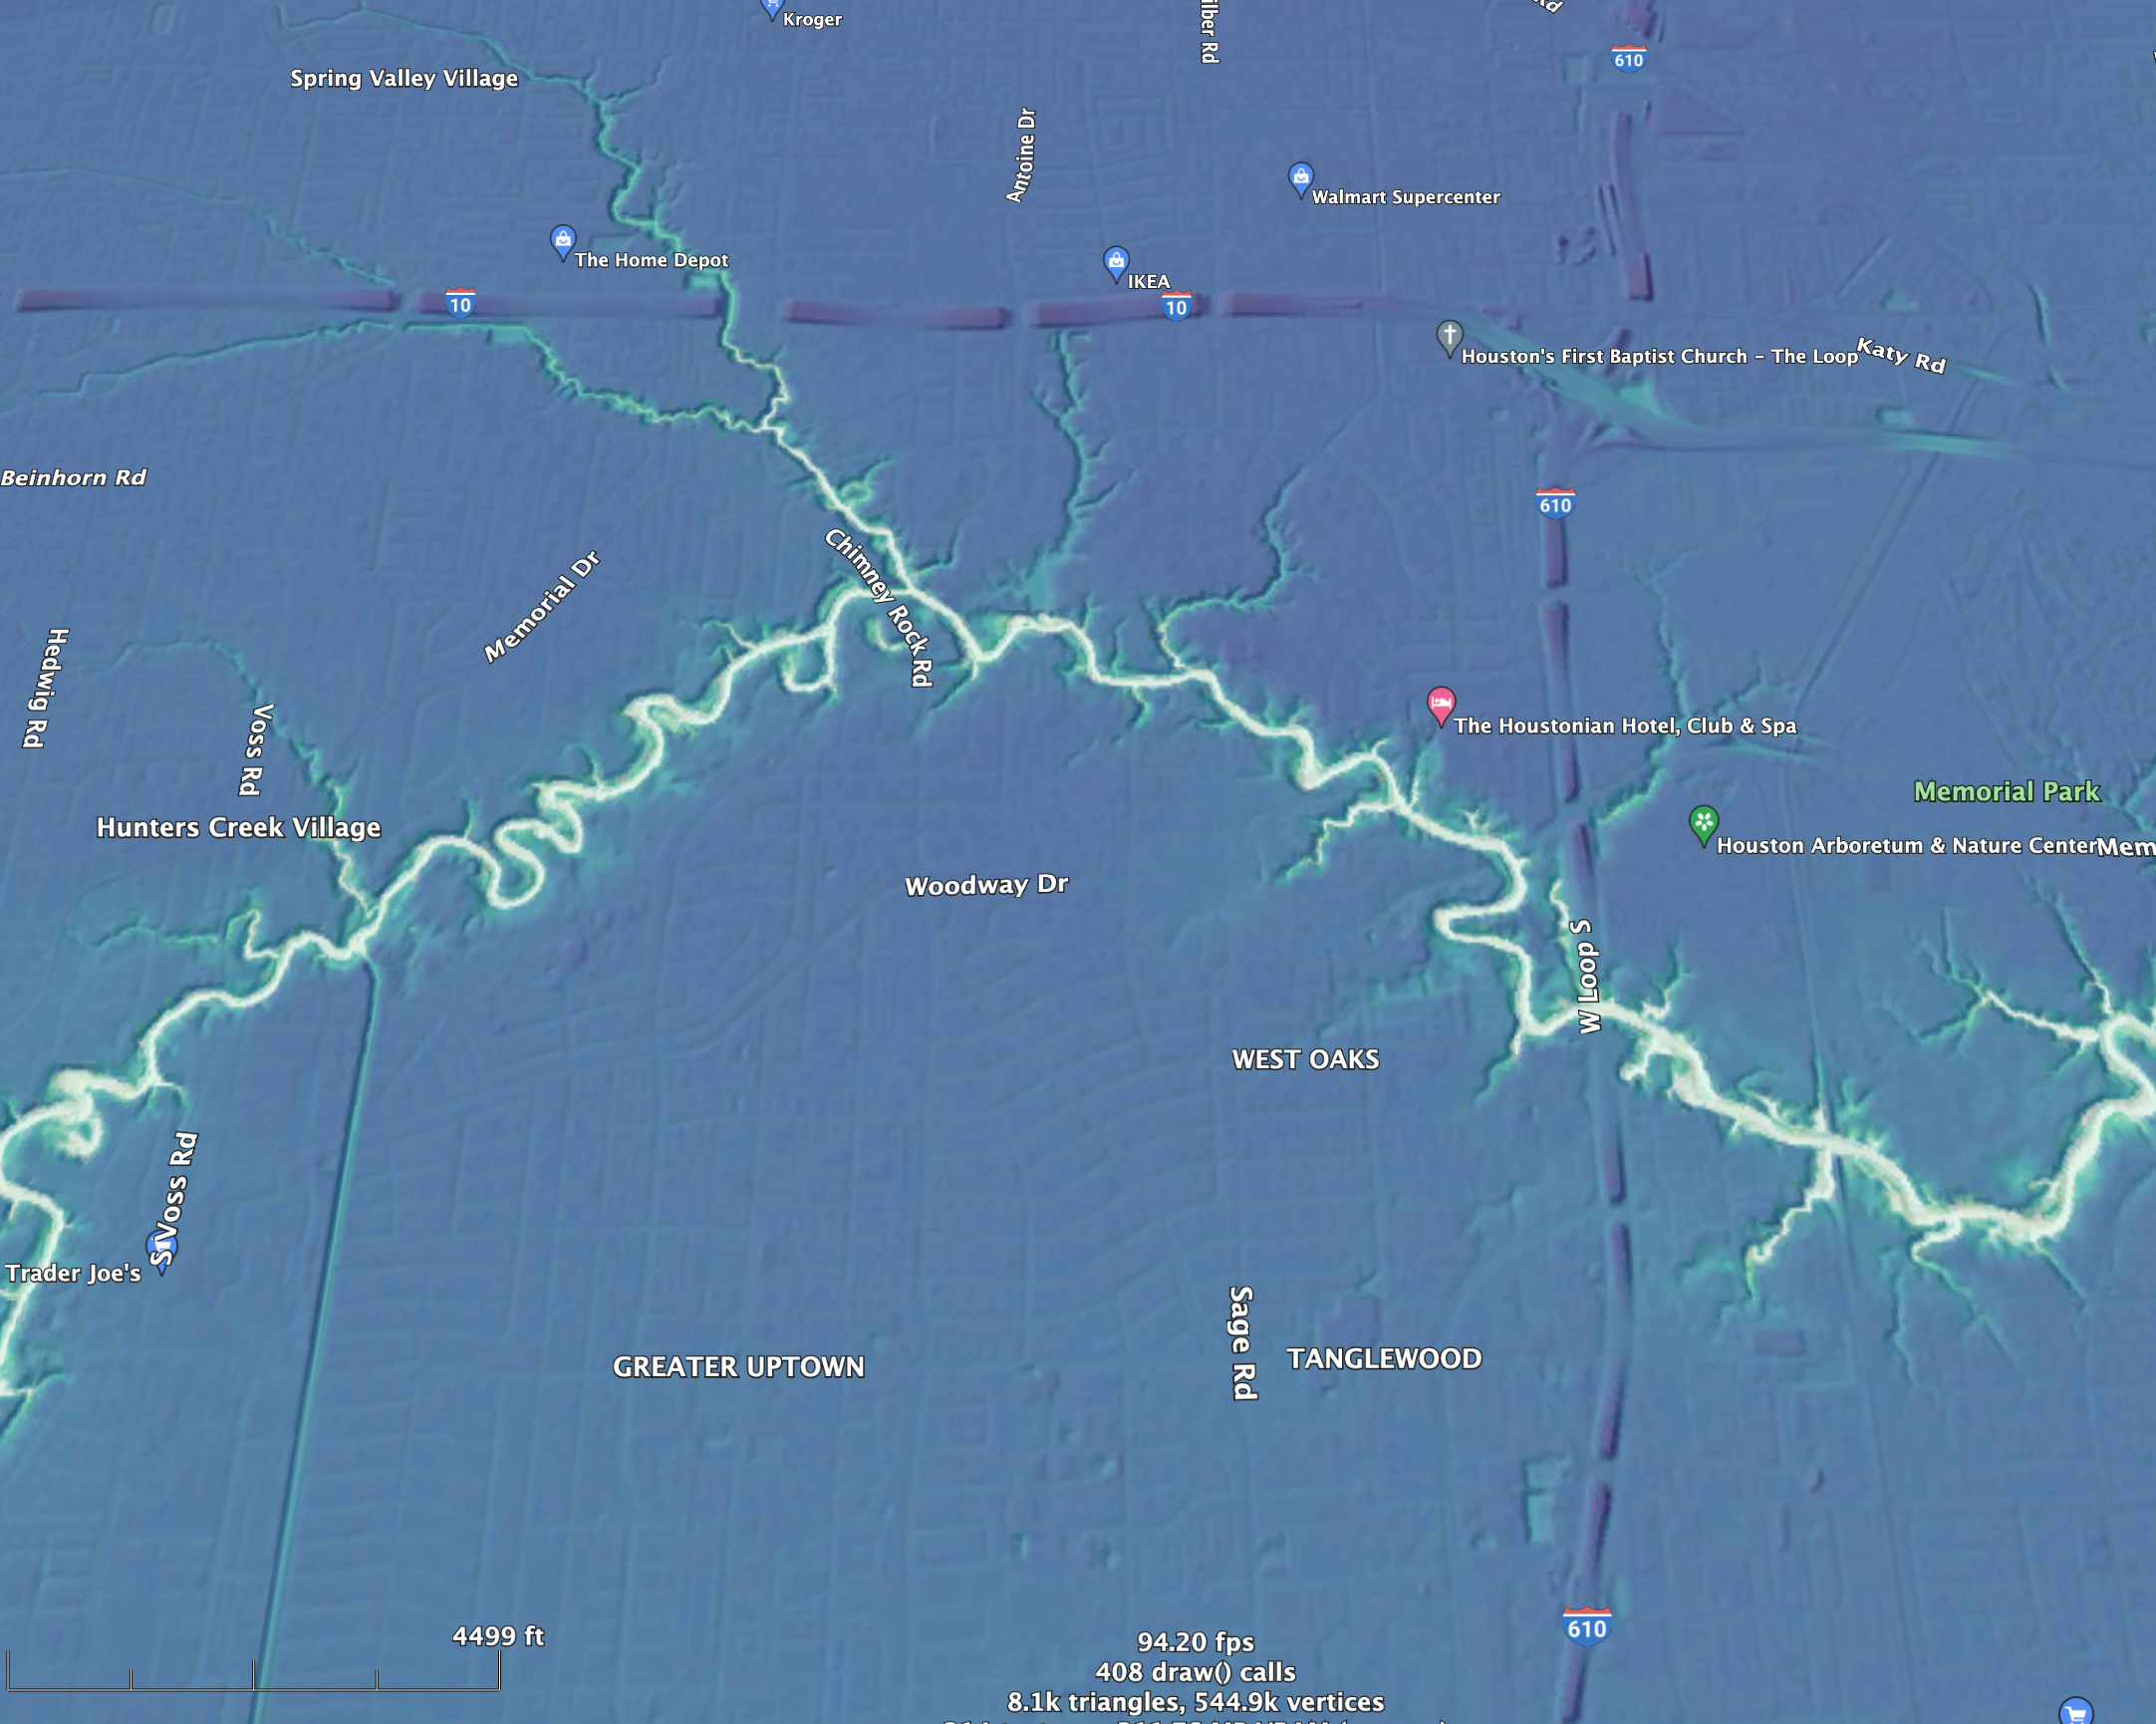 Buffalo bayou's channel has much less of an oversized valley relative to size of current flow.
It comparitively less preserved meanders and many more dendretic channels flowing into it, given
the impression of a more erosional river with less sediment transport compared to the Trinity,
at least based on morphology expressed in the REM alone.
Buffalo bayou's channel has much less of an oversized valley relative to size of current flow.
It comparitively less preserved meanders and many more dendretic channels flowing into it, given
the impression of a more erosional river with less sediment transport compared to the Trinity,
at least based on morphology expressed in the REM alone.
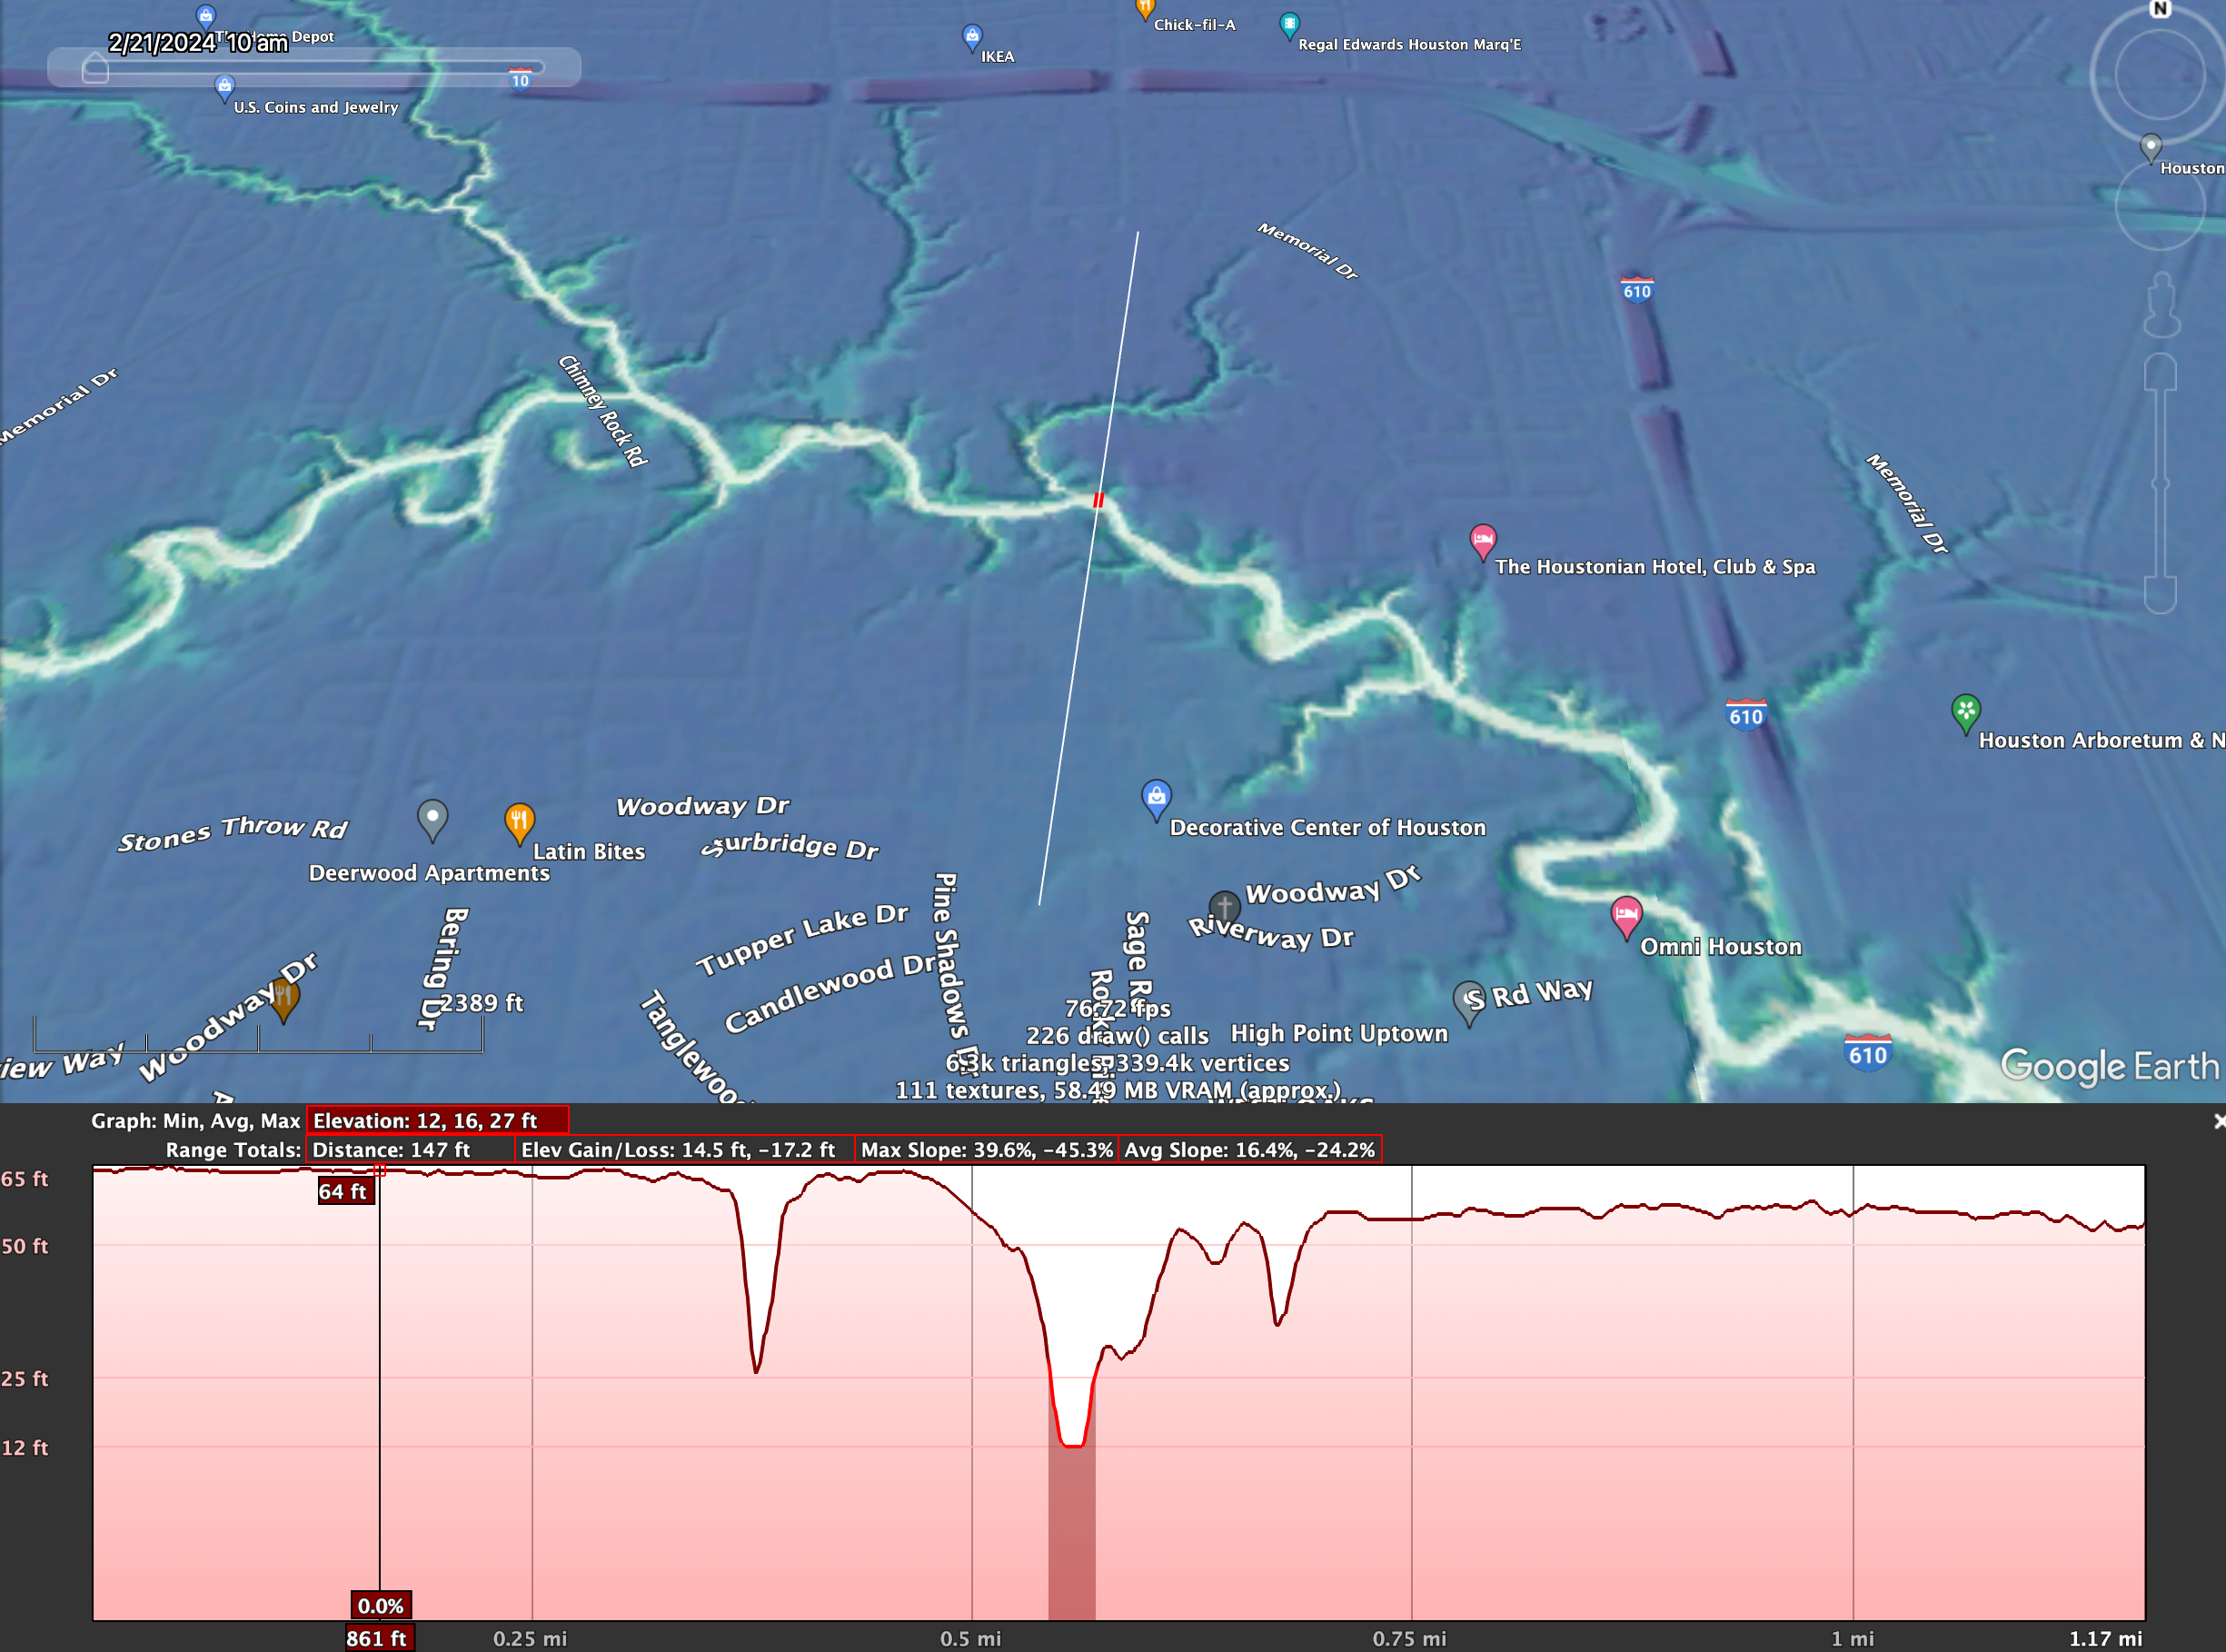 Elevation profile of Buffalo Bayou.
The elevation profile cuts through the main Buffalo Bayou channel and several small tributaries that drain into it. Channels are relatively sharp and narrow with active river channel being a single order fraction of the width.
Summary of observations so far
Although there are exceptions and dividing rivers into only two classes is a simplification, we can summarize a lot by diving rivers into two classes.
One is larger rivers with active channels moving through larger valleys that drain much larger areas. These rivers seem to have more sediment stored in their floodplains and valleys. They flow mostly south south east before dumping their sediment in a bay or the Gulf of Mexico. The other is smaller rivers with much smaller watershed areas that are more incised v-shaped valleys. They area more likely to flow west to east.
Why does Buffalo Bayou flow west to east?
At this I'll need to get a bit into geology and not just observations from the REM. I previously mentioned that the Brazos River has a large watershed and carries sediment all the way to the sea. Geologically, the Brazos River has been doing this for a long time with sediment cores showing a long history of sediment deposition in the Brazos delta. It has been able to do this area the rate of sediment coming out of the Brazos is high enough to match rate of sea level rise. In contrast the Trinity and San Jacinto rivers have not been able to keep up with the rate of sea level rise. That's why there is a Galveston bay that they flow into rather either river reaching the sea directly.
This different in sediment transport might have also occurred in the past when sea level was lower. When sea level is lower, these rivers would have eroded a channel to the sea. When sea level rose, that accommodation space was filled with sediment and water. That lower San Jacinto channel also potentially explains why Buffalo Bayou flows east. It would have been a nearby low point in the topography that was not filled in with sediment that was much closer than the shoreface farther to the south. As a result, river channels developed flowning east rather than south. An additional reason may be sediment from the Brazos over topping its valley edge and depositing levees and delta lobes (at high sea levels) to its east.
This interpretation seems to be consistent with modern elevation profiles we can extract using Google Earth Pro.
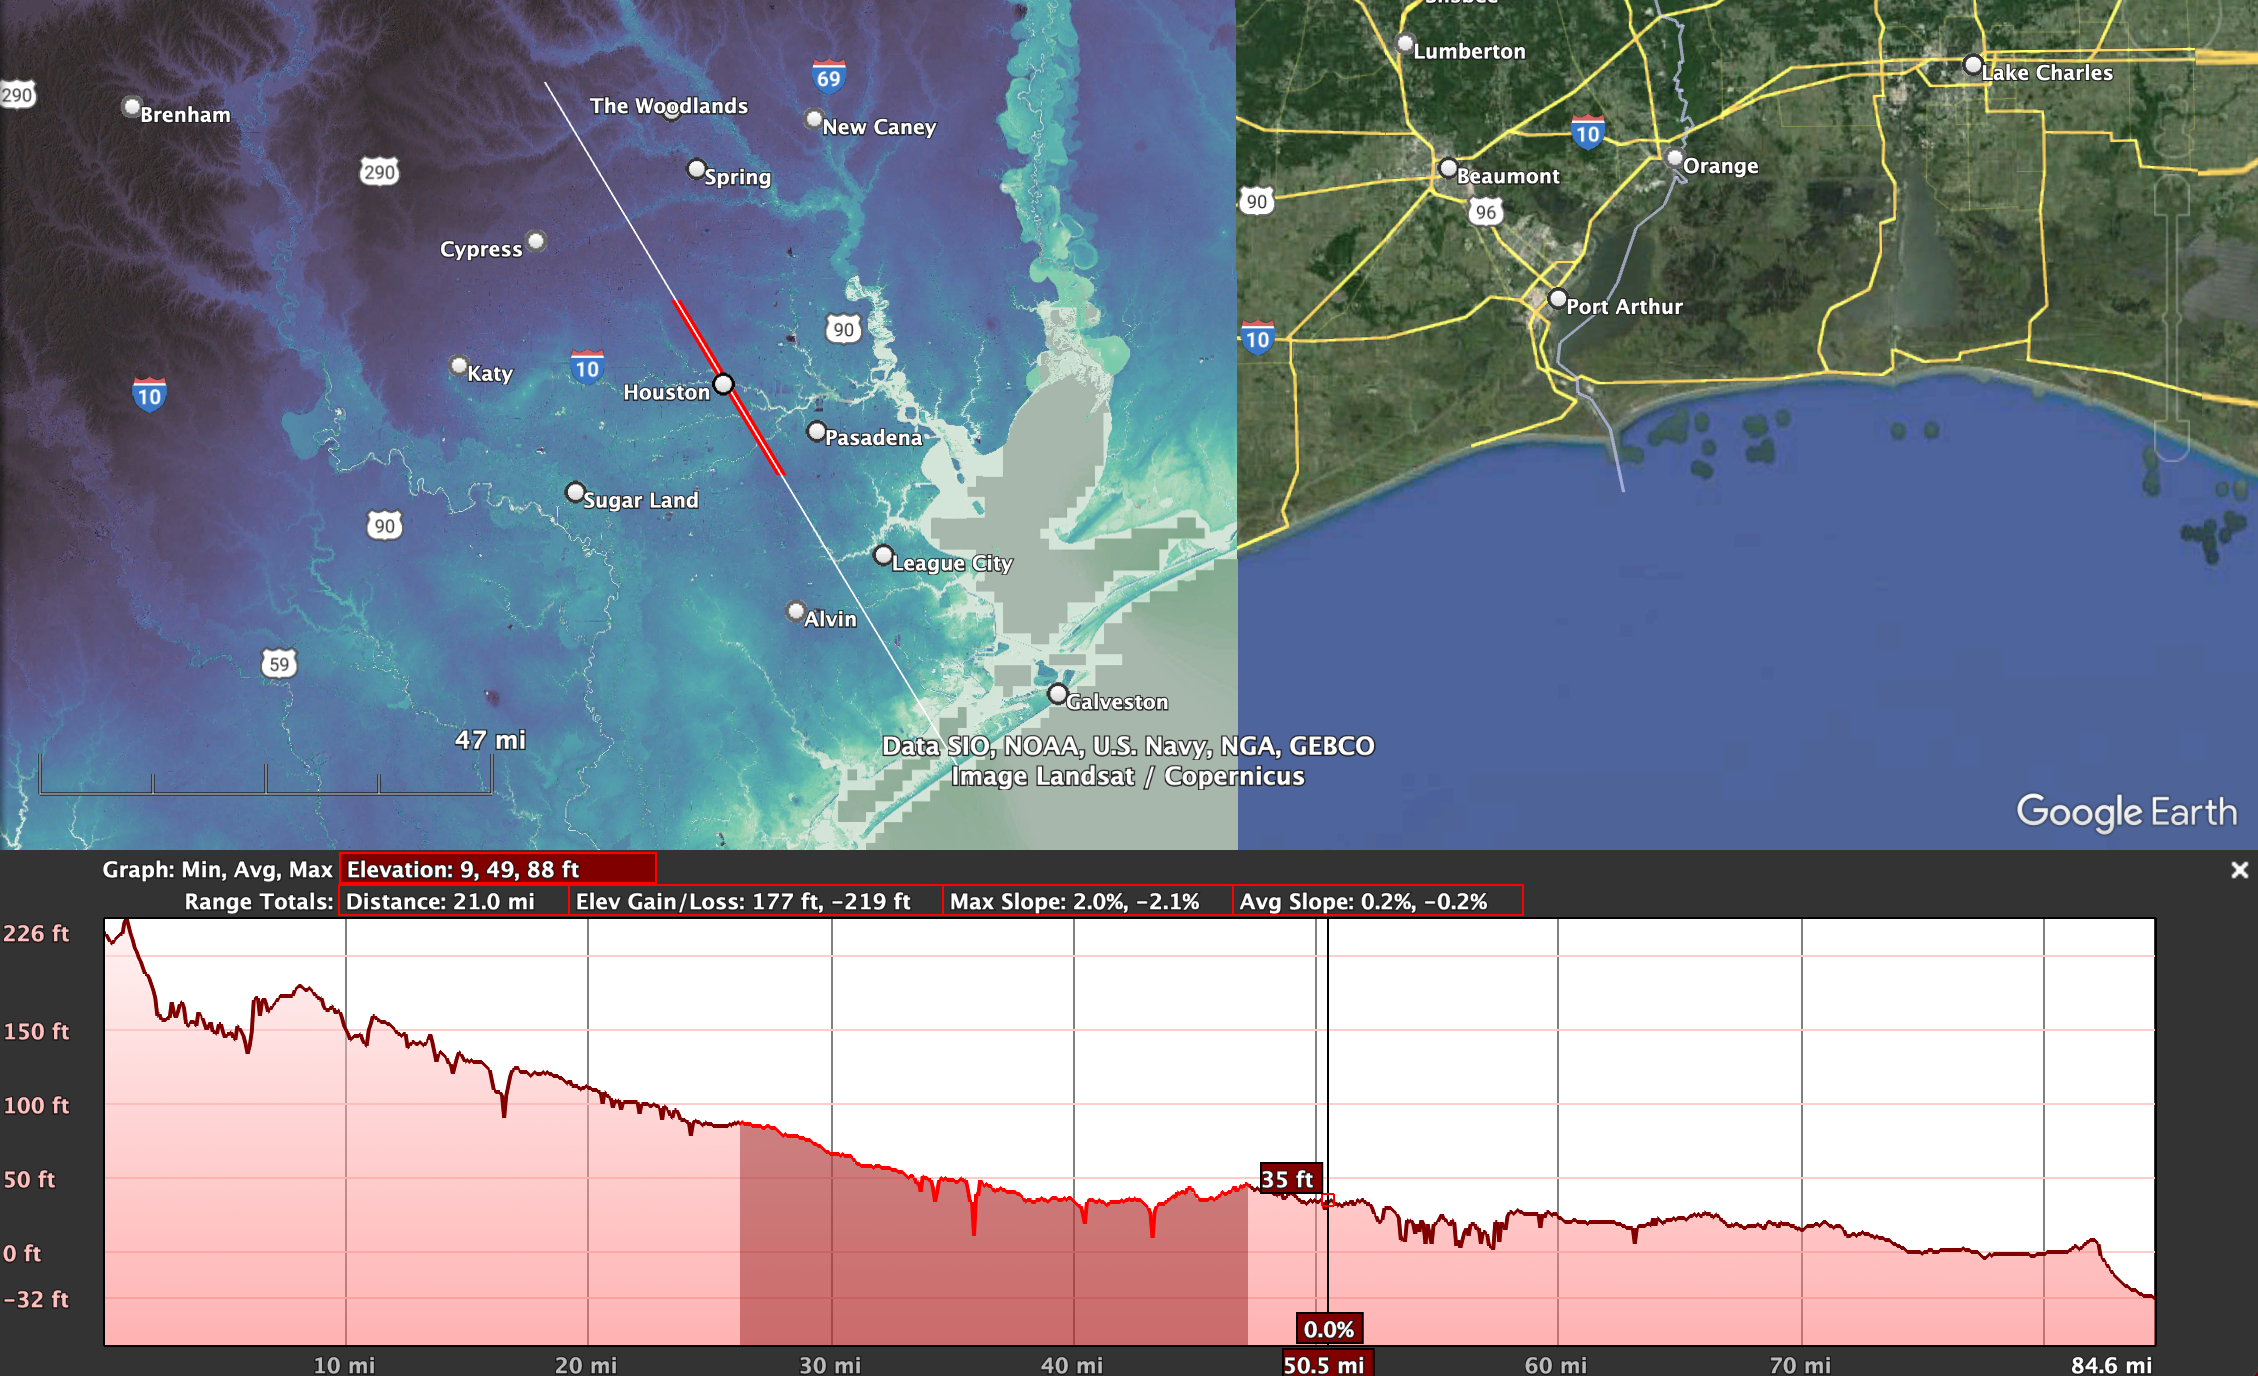 REM map with elevation profile line drawn in south south east direction with red highlighted area
being the extent of the Buffalo Bayou watershed.
REM map with elevation profile line drawn in south south east direction with red highlighted area
being the extent of the Buffalo Bayou watershed.
On this elevation profile, you can see on the elevation profile how the edges of the Buffalo Bayou watershed are slightly higher and define the boundaries of the watershed. Although the perception in car driving down the beach in Galveston is that you're driving "down", you'll actually be driving uphill for some of the drive, just hard to notice due to the relatively flat topography.
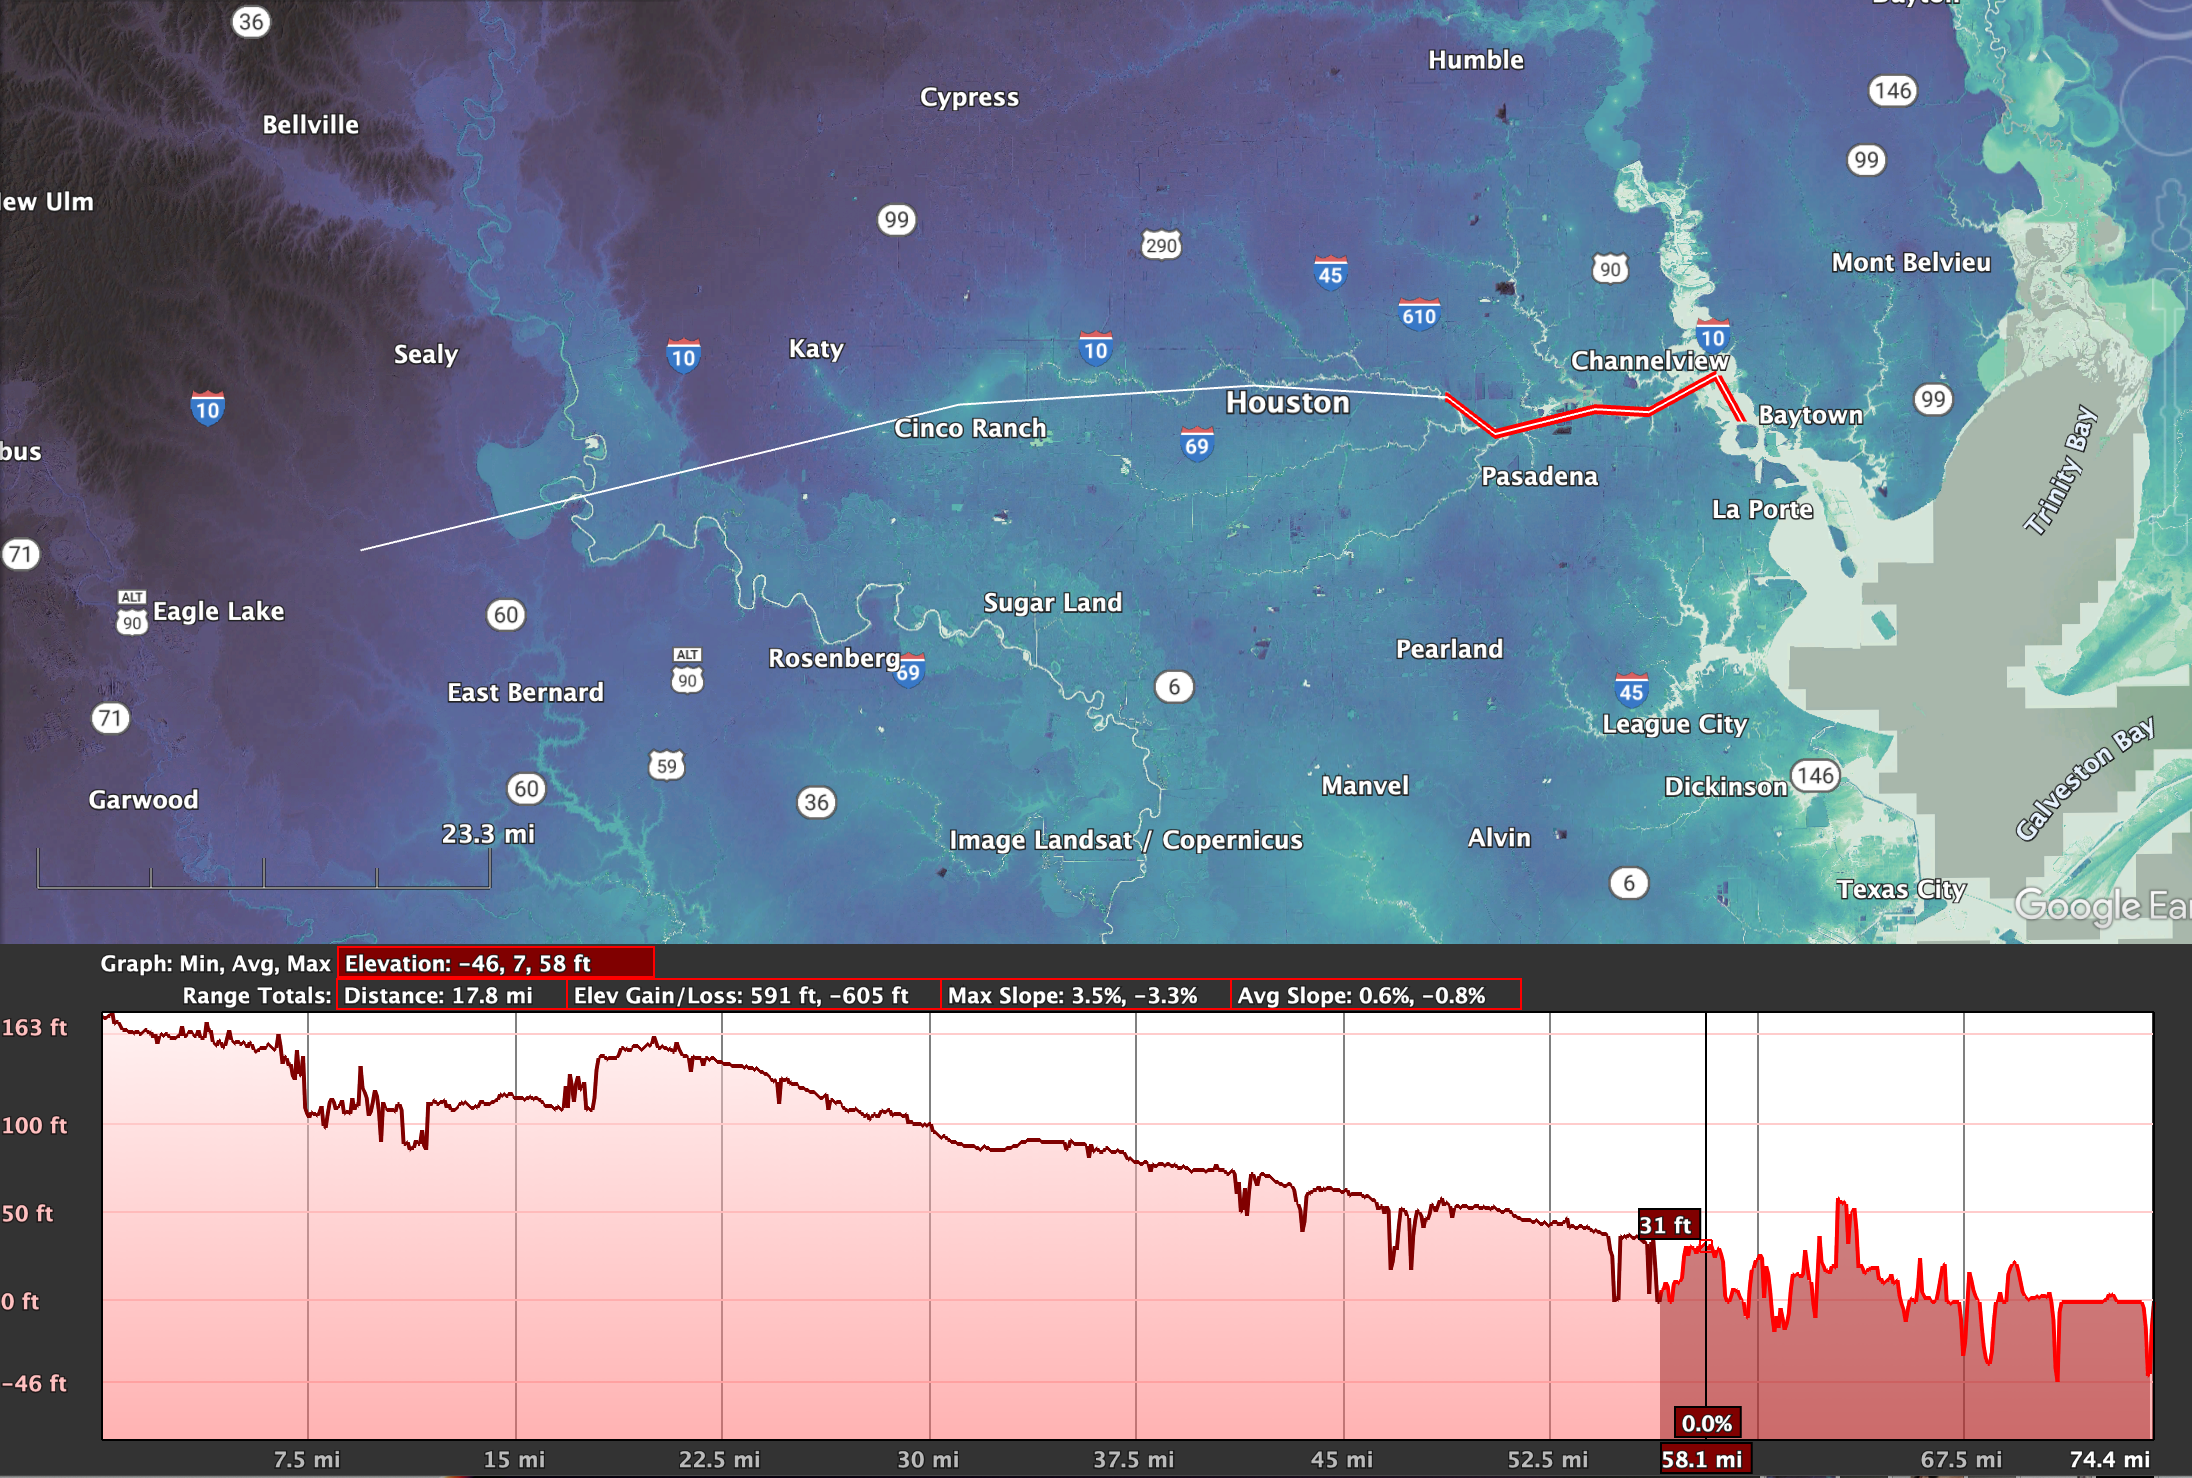 REM map with elevation profile drawn west to east with red lighted area where there is evidence the
the bottom of channels are at or below sea level.
REM map with elevation profile drawn west to east with red lighted area where there is evidence the
the bottom of channels are at or below sea level.
I am skeptical that the elevation data inside the ship channel is accurate as it is a repeatedly dredged channel. However, it is worth pointing out for the reason that once water reaches sea level, there's less gravitational force to keep pushing it. This means water draining from most of the city of Houston reaches the elevation of sea level before it even gets into Galveston Bay or the Gulf of Mexico but rather when it is still confined to the Buffalo Bayou channel.
What about structural control?
It doesn't seem like there's a lot of structural controls (faults, folds, salt bodies) on regional flow direction of Buffalo Bayou. There REM does suggest very local faults and salt bodies might push bayous a little this way or that, but the overall flow direction seems to be controlled by the topography and sediment supply. Looking at this aspect in detail with examples would require much more analysis and its own blog post, so I'll leave it at that for now.
Conclusion: Why does Buffalo Bayou flow west to east?
- Sea level rise and fall has caused a relatively pancake coastal plain to develop.
- The San Jacinto river cut down during low level sea level creating an easier and quicker path to sea level than going south south east to the shoreline.
- The Brazos River transported relatively high levels of sediment and deposited levees and delta lobes of its eastern edge.
In summary, blame it on Brazos river having too much sediment and the San Jacinto river not having enough. Either way, it was much easier to incise into the coastal plain and flow to the east than south or west.